52-week high and low is important in trading, especially stock trading, because of the underlying effect in prediction, serves as a technical indicator, analysis of current stock values, and future price movement. Some trading values are the ability to predict with less risk and understand future price movement. If you understand the principle, the week, day, and monthly high/low give you all of these. This article discusses the 52-week high and low and how you can maximize it for profit. Here is how:
What is the week, day, and monthly high/low (52 week high and low)
Again, the 52-week high and low is the overall (sequence manner) breakdown of a security’s highest and lowest price values within a year. As mentioned above, days in a week and weeks in a year are important for calculating the 52-week high and low. As simple as the records seem, they serve lifetime benefits to active traders. The importance cannot be overthrown unless a better trading indicator arrives in the future. Let’s learn more about 52-week high/low.
52-week high and low as a technical indicator
Technical analysis requires indicators for better effectiveness. Traders who understand the importance and application of technical analysis profit beyond usual traders – this is why it is necessary to use a 52-week high/low as a technical indicator.
Technical indicators are values derived from the volume, price, or security (or combine) used for trading and prediction. Technical indicators are in the form of patterns requiring understanding and interpretation. 52-week high/low is more of a historical value for prediction: technical indicators are simply historical data used to predict the future. 52-week high/low predicts the future in the stock market and reduces loss and risk.
As a technical indicator, 52-week high/low effects are investment evaluation and identifying trading opportunities. The approach focuses on the price movement over the last 52 weeks. Price and volume are powerful in trading: while a typical trader focuses on the financial or economic data, the technical analyst uses 52-week high/low to figure price movement and effective trading signals.
A 52-week high/low is versatile: applicable to futures, currencies, stocks, fixed-income, commodities, and other securities. 52-week high/low applies to these securities because they adapt to historical trading data.
Lastly, active traders use 52-week high/low for short-term price movements; long-term investors use it to identify entry and exit points.
52-week high and low, the stock price and value
Again, a 52-week high/low is the price range for 52 weeks: it shows the stock value instead of the current stock price. The stock price has little or no effect on the market behavior (if a trade will benefit you or not); however, price value does.
For example, Company A laid off staff because of internal issues and less productivity (low stock value); however, the company increased its stock price because of the action (high stock price). Another company B increased productivity and resolved all internal issues making smooth production (high stock value) but could not maintain the highest market price at the moment (low stock price). If you consider the current stock price, you may likely invest with Company A; however, if you consider the stock value, you might invest with company B.
Both companies have historical data: company A shows poor data while company B shows excellent data. Obviously, company B has more potential to succeed than company A.
52-week high and low gives you a record of stock value and not stock price. The period of 52 weeks accumulates the records (values); it is not that the 52nd week is the main value. No! The 52-week high/end gives a range of prices from which you derive outstanding data for future use. The current price cannot predict the future; however, the current price value does. Understanding current price and value is essential for effective use of 52-week high/low.
For example, a stock drops from $500 to $200 and may go down to $100, while a stock that goes up from $100 to $200 may go further to $500. This price range is the information that the 52-week high/low provides.
The transition between “$500 to “$200 and probably $100” is the stock value. A trader focusing on the latest stock price ($100) without considering the previous price fall may suffer a loss. Conversely, a trader studying the stock value (a fall from “$500 to “$200 to $100”) might not invest.
The 52-week high and low relates the present to the past (stock value): a better approach to understanding the current stock price and its effect on your investment.
The 52-week high and low tells you not to jump on prices; instead, it shows you a better opportunity and how to predict the future. Even if the price looks good, the underlying effects and how the price comes to be, matter. These and more are the advantages of the 52-week high/low.
Application of 52-week high and low
The 52-week high/low is applicable in many cases, usually in the values that support historical trading data. For example, trade is risk-minimized after a study showing the entry and exist points. The first step in determining profits is securing a good entry point and exist points.
52-week high and low and entry point
Again, an entry point secures a trade with prediction and risk-limiting factors. The 52-week high and low ensures a good entry point. Here is how:

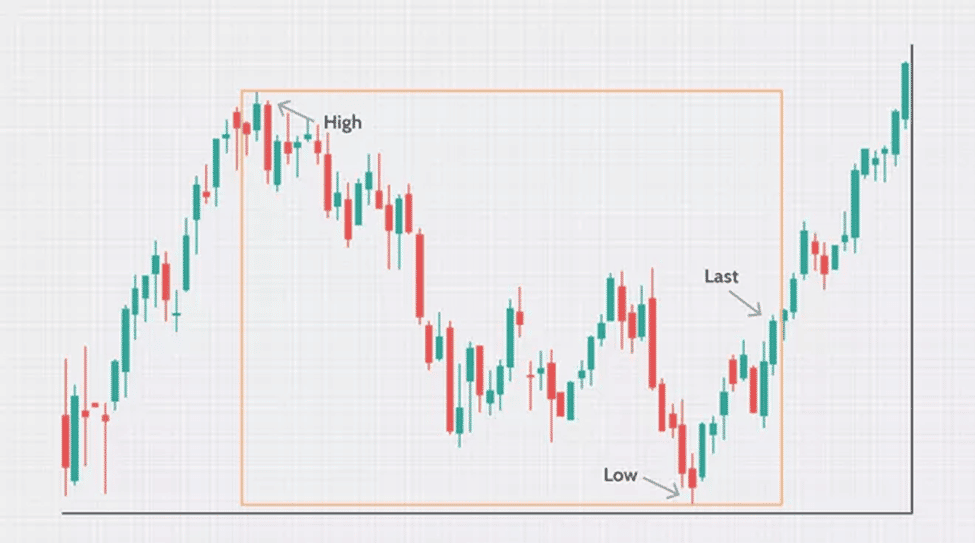
52-week high and low shows a tendency of price movement in the same direction as the trend if the price breaches the 52-week range. The 52-week range evaluates the high or low breakouts: the breakout can go low or high within the range. Figuring out a good entry point is simple with a 52-week range: the price movements elongate in the same direction as the trend in the 52-week range (high or low). For example, following the previous explanation, traders may buy when the price passes its 52-week high or sell when the price falls below its 52-week low.
Several factors and trading forces continue to push the price in the direction of the momentum: the 52-week high or low direction. Thus, a seller follows the trend and sells at the point where the price passes the 52-week high, and buys when the price passes the 52-week low.
Another advantage is the application of a stop order to limit risk. Although you have predicted the price flow: it is far better to save your prediction with limited risk (by using stop order). Again, the 52-week range not only shows the entry point but also predicts the position of the stop order.
From another angle, a 52-week high/low gives a better entry point when a price gets to its 52-week high intraday and then closes negative: meaning that the price may not increase soon. Thus, focusing on this reduces the chances of investing in unprofitable stocks and gives a better analysis of why you take action on any trade. It is way better to figure out why you perform an action in trading than trading out of the proof analysis. Even if you run at a loss, you will know what has gone wrong. The 52-week high/low increases the chance of gaining and gives you the breakdown of your fault if you run at a loss.
A 52-week high indicates a possible price increase and reasons to enter a trade.
Applying 52-week on volume for better profits
The volume shows how much security passes the trade cycle in a period. Volume is important in stock and majorly classified as shares – the number of shares traded is referred to as volume. Volume plus trading indicators give better market interpretation and decision – no trader takes volume lightly. In addition, a 52-week high/low gives an excellent account and how to apply volume for gain.
Analyzing the 52-week range and volume gives you an idea of the weakness and strength of a move. Strong moves potentially show positive output contrary to the weak moves. Although this is not always true – combining the action of 52-week with the volume values gives better decision and better conviction on the moves.
The 52-week validate trend via volume
Technically, a rising market sector ought to see rising volume. Buyers require expanding numbers and expanding energy to continue to push prices higher. Expanding cost and diminishing volume could show indifference, a caution of an expected inversion. This can be difficult to understand, yet the straightforward reality is that a value drop (or ascend) on little volume is not a solid sign. A value drop (or ascend) in enormous volume is a more grounded signal that something in the stock has changed on a very basic level.
Again, a 52-week high/low shows the tendency of price movement in the same direction if the price breaches the 52-week range. The 52-week range evaluates the high or low breakouts: the breakout can go low or high within the range. For example, traders may buy when the price passes its 52-week high or sell when it falls below its 52-week low.
Following the impact of volume and 52-week high/low on trend are two authentication factors for analyzing entry points. From the above statement, “a rising market sector ought to see rising volume.” This statement is more grounded when “the 52-week is high since it indicates a possible increase on price, and possible points to enter a trade.” The rising volume and a 52-week high show a more grounded reason to enter a trade.
52-week range and volume spike
Volume spike indicates increased volume: a share circulating at 100,000 suddenly increases to 400,000. A volume spike is a sudden effect in trading, although a 52-week range may tell you about a volume spike before it happens. Everything works on possibility; however, the level or degree at which the prediction is likely to occur is important.
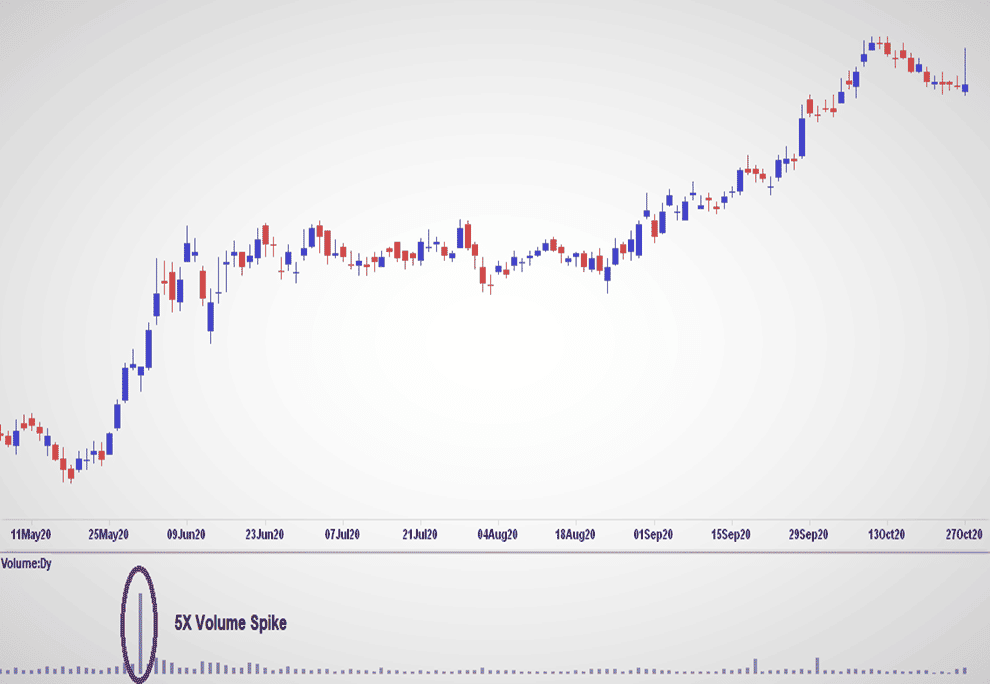
The volume may spike when the price exceeds the 52-week barrier: you can predict a volume spike if you know the current volume and the 52-week range. Volume spike might result from traders moving their security out or into a trade. The prediction saves you from loss regarding volume spike.
A volume spike is essential in understanding the direction of the underlying. If you know the direction, you know where to enter the trade. Thus, a volume spike via analyzing the 52-week barrier can lead you to outstanding profits.
52-week high/low reversals
As mentioned above, a 52-week high/low gives a better entry point when a price gets to its 52-week high intraday and then closes negative: meaning that the price may not increase soon. Thus, focusing on this reduces the chances of investing in unprofitable stocks and gives a better analysis of why you take action on any trade.
At this point, a simple lookout for shooting stars: the closing price is lower than or near the closing price. The price fluctuation follows this trend: the security values trade more than the opening price but suddenly fall towards the end. The 52-week high/low reversals are a way professionals lock their profit and escape loss, especially in the case of shooting stars.
Pullbacks and trend reversals connect with stocks making new 52-week highs; thus, they guarantee profits and the likelihood of ending with gains. Likewise, the bottom may come in if the makes a new 52-week low intra-day; however, it does not close a new 52-week low. Hammer candlesticks come to play in this case. When security exchanges are lower than their opening, they mobilize later in the day to close either above or close to their initial cost.
Lastly, hammer candlesticks may cause short-traders to begin purchasing and can likewise urge bargain hunters to take action.
Bottom line
Understanding and applying 52-week high/low can increase risk-management skills in treading. It may also give you better ground on decision-making, interpretation, and predictions.