Understanding the Bollinger Bands
Developed by John Bollinger, Bollinger Band comes with three lines. The middle line is a standard deviation moving average. The other two lines appear on either side of the center line and act as upper and lower bands.

With the technical indicator, one can decide the number of standard deviations that the upper and lower bands will be from the middle line. The standard deviations will then determine the distance between the upper band and the center line and the lower band and the central line.
Price often oscillates between the upper and the lower band. How far the price is from the middle line affirms the direction it is moving and the trend’s strength. Whenever the price is below the center line, it signals a downtrend implying that prices are likely to continue edging lower. Likewise, when prices are above the middle line, it signals an uptrend suggesting prices will increase.
Whenever the Bollinger band narrows, it implies waning momentum in a given direction. It could also suggest consolidation in preparation for a potential price breakout. Conversely, whenever the bands increase in size, it confirms a build-up in momentum in a given direction.
Bollinger Bands Overbought
Whenever the market is at equilibrium, the price tends to oscillate within the middle line of the Bollinger bands. In this case, it affirms that neither buyers nor sellers are in control and that prices will likely move up and down within a predefined range without making any new highs or new lows.
Nevertheless, whenever there is too much selling pressure in the market, the price could tumble significantly to the extent of moving away from the middle line and onto the lower band. Therefore, when prices fall too much due to increased selling pressure and penetrating the lower band of the Bollinger bands, the underlying asset price is considered oversold.
The oversold condition implies that the underlying asset is sold too much. During such scenarios, some short sellers tend to exit the market as a way of taking profits on price tumbling significantly.
As short sellers exit the market, the force at which price tumbles tends to decline, resulting in price bouncing back. The bounce back can be vital as buyers enter the market and try to take advantage of the low price.
Consequently, whenever the price penetrates the lower band confirming oversold conditions, a bounce back should be expected as savvy investors use the opportunity to open buy or long positions.
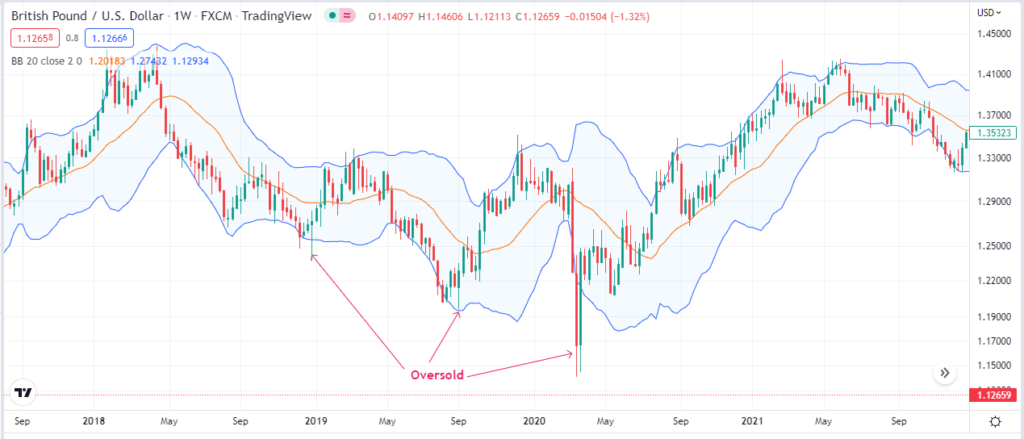
From the gold price chart above, it is clear that they bounced back whenever prices penetrated the lower band. The bounce back came into play as buyers used the opportunity to buy low, as short sellers exited the market.
Nevertheless, it is essential to note that price does not always bounce back when the oversold conditions kick in. price can continue moving lower even if the Bollinger Bands signal the underlying asset price is sold too much. Therefore, it is vital to use other indicators and candlestick patterns to confirm that price is reversing from the downtrend to an uptrend if in oversold territory.
Bollinger Bands Overbought
The overbought conditions manifest whenever the underlying asset is bought too much. Consequently, the price will increase to the extent of penetrating the upper band of the Bollinger Band. The band will widen significantly during this period, affirming the strong upward momentum.
Some traders refrain from buying more when the technical indicator signals overbought conditions. Consequently, the buying pressure tends to wane as very few traders would be willing to buy at extreme highs.
As the buying pressure wanes on price penetrating the upper band, the risk of a reversal is usually high. Consequently, the price will reverse from an uptrend to a downtrend as short sellers enter the market and try to sell high.
With Bollinger Bands, the price tends to oscillate between the upper and the lower bands. Consequently, the reversal will occur whenever the market is overbought, resulting in price retreating from the upper band headed towards the lower band as buyers exit and short sellers pile pressure.
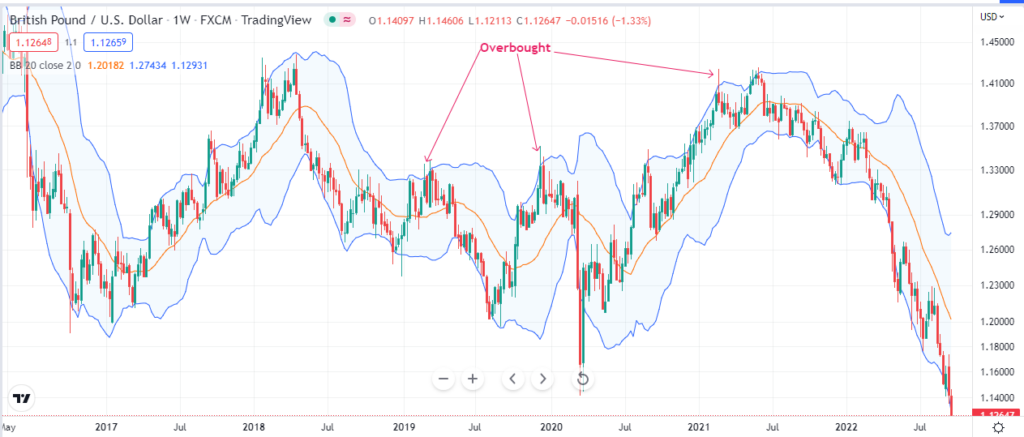
From the chart above, it is clear that the price did end up retreating from the extreme highs after penetrating the upper band. The reversal came into play as shorts sellers used the opportunity to sell high as buyers started taking profits.
However, the price does not always reverse once the upper band penetrates. As a result, the price can continue increasing even though the technical indicator signals overbought conditions. Therefore, it is essential to use other technical indicators or tools to confirm that a reversal from the uptrends is about to occur when overbought.
Bollinger Bands provide more reliable trading signals when dealing with range-bound markets whereby prices oscillate between a support and a resistance level. During strong trends, there is usually the risk of entering a trade on the wrong side of the indicator on overbought or oversold signals.
Therefore, it is important to only open trades in the direction of the underlying trend. For instance, if the price was moving lower and the indicator signaled oversold, the best play would be to wait for the price to bounce back and then enter a short position to take advantage of the bearish momentum.
Opening an opposite trade just because the indicator signaled overbought or oversold is usually not the smartest of moves. One of the best ways to remedy the indicator’s weakness in providing reliable trading signals during overbought or oversold conditions is to use another technical indicator.
The Moving Average Convergence and divergence Indicator
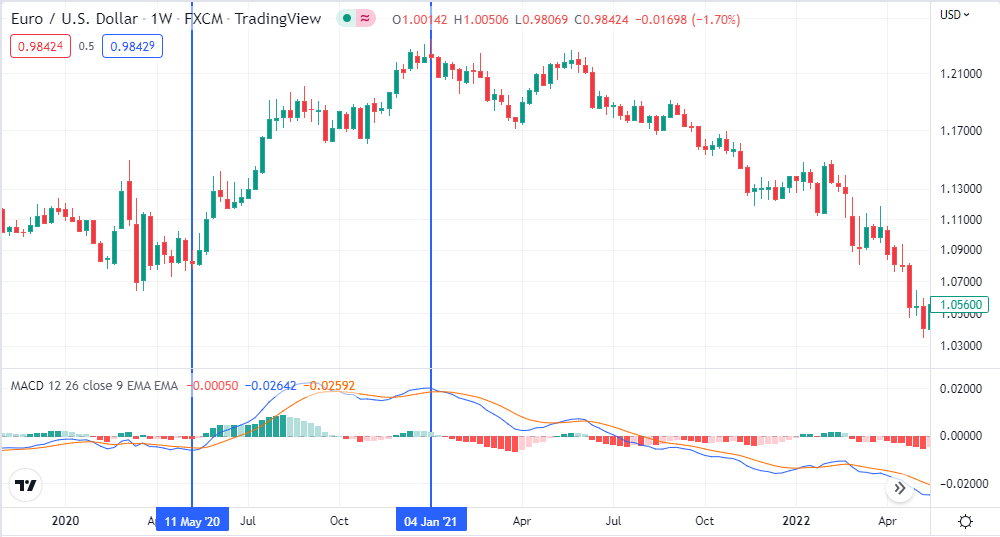
The moving average convergence and divergence is a technical momentum indicator. The technical indicator can help complement the Bollinger Band by signaling whether the underlying price will remain oversold, overbought, or reverse direction and start moving in the opposite direction.
It consists of two moving averages. A fast-moving average is depicted as the MACD line, while the slow-moving average is described as the Signal line. Whenever the fast-moving MACD line crosses the Signal line and moves up, it implies a build-up in buying momentum, implying that prices are poised to trend up from a downtrend.
A build-up in buying momentum implies that buyers have overpowered bears and are likely to continue pushing prices higher. Consequently, traders should look to open buy positions as the price is expected to increase.
Similarly, whenever the MACD line crosses the signal line and starts edging lower, it implies a build-up in selling pressure. Consequently, it signals a change from bullish to bearish momentum on short sellers overpowering buyers. Therefore, it is a reliable signal to eye long or buys positions.
The MACD indicator also comes with a histogram that forms above or below the zero line. Whenever the upward momentum builds up on the MACD line crossing the signal line and moving up, the Histogram will increase in size above the zero line signaling a build-up in upward momentum. Conversely, whenever the histogram size decreases in height above the zero line, it implies waning upward momentum.
Likewise, whenever the MACD line crosses the Signal line and moves lower, the Histogram will appear below the zero line and balloon in size as the downward momentum increases. When the histogram size starts decreasing, the downward momentum is fading, suggesting the likelihood of the price reversing course and moving up.
The Bollinger Band MACD Strategy
Using the Bollinger Bands and the MACD indicator makes it easy to time the market and knows the ideal time to enter a position after oversold and overbought conditions kick in. In addition, the MACD is a lagging indicator that takes some time before signaling a reversal is in play, making it easy to avoid fall breakouts.
With this strategy, the idea is to wait for the Bollinger bands to signal that the price has increased significantly to a level of being overbought or oversold too much to confirm it is oversold. Then, once we are dealing with the oversold or overbought condition, the focus shifts towards the MACD indicator, waiting for a crossover of the MACD line and the Signal line to be sure that momentum in the opposite direction is building up.
MACD & Bollinger Bands Buy/Long Set up
The signal to prepare for buy or long positions starts with the price plunging significantly to a level that the Bollinger Bands confirm oversold condition. However, at this level, it is expected that the price will not tank further as short sellers start taking profit, paving the way for bulls to enter the market.
The confirmation that it is time to open a buy position comes on the MACD line crossing the Signal line and starting to move up. The MACD line moving up implies bulls have overpowered bears and are likely to push prices higher. The Histogram increases in size above the zero line as the MACD line trends up to confirm the buy signal paving the way to enter long positions.
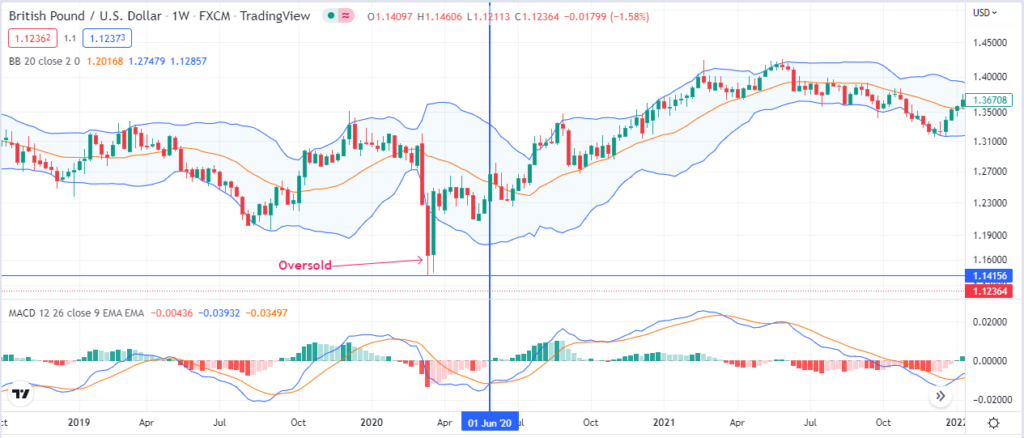
The GBPUSD price chart above shows the price plunging to the extent of piercing through the lower band, confirming the oversold condition at the 1.1415 level. At the extreme lows, the MACD indicator does not show any signs of crossover as short sellers remain in control, with bulls struggling to steer any significant move higher.
However, after some time, the bulls overpower bears after forming a bullish engulfing pattern and bears struggle to push prices lower afterward. As a result, the MACD line (in blue) crosses over the Signal line (in Orange).
Once the crossover occurred, it confirmed a change in momentum from bearish to bullish. Therefore, this was the best time to open a buy position as the Histogram size had started increasing above the zero line, and the price had begun moving away from the lower band. A trader could have placed a stop loss order below the previous low to avert the risk of incurring losses on prices continuing to move lower in continuation of the previous downtrend.
MACD & Bollinger Bands Sell/Short Set up
In this case, the sell setup occurs when the Bollinger Band signals an overbought condition implying that the asset price is bought too much. At the same time, the cost can continue increasing even with the overbought conditions in play, the focus shift towards the MACD indicator that will signal when the downward momentum is building up, implying the end of the uptrend and the start of the downtrend.
The MACD line crossing the Signal line and moving lower should be an early warning of a momentum shift from bullish to bearish, paving the way to explore the possibility of opening short/sell positions.
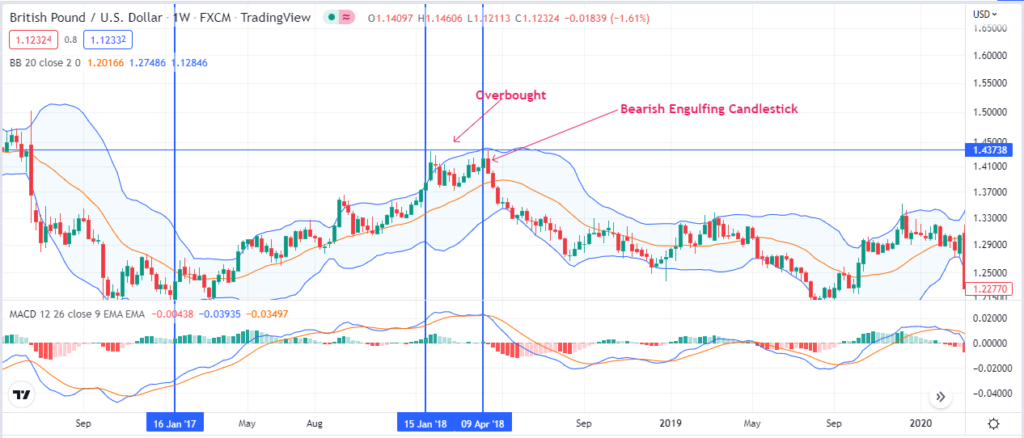
The price chart above shows that GBPUSD was in an uptrend between January 2017 and January 2018 when overbought conditions kicked in, with price penetrating the upper price band. However, the price continued trending despite the overbought conditions in full swing. Nevertheless, the price did not rise significantly, as was the case during the uptrend.
The MACD indicator also started flattening as the overbought conditions came into play. The crossover at the start of April confirmed the momentum shift from bullish to bearish. The formation of a Bearish engulfing candlestick at the top of the chart affirmed that it was time to explore the possibility of entering short positions as bears had overpowered bulls and were poised to push prices lower.
Afterward, prices edged lower as short sellers used the opportunity to sell high. Traders who opened short positions could have placed stop loss orders a few pips above the previous high to protect themselves against price reversing and moving up.
Bottom line
Bollinger Bands is one of the best technical analysis indicators for determining overbought and oversold conditions in technical analysis. Combined with the MACD indicator, it becomes much easier to ascertain price reversal from the extreme highs and lows.