Chart pattern puts stock market buying and trading into perspective. It plays an important role when it comes to analyzing the trading charts. You get to see the transition in the chart pattern and analyze it to make better trading decisions.
To know exactly what you are looking at, let’s get to know more about chart patterns.
What are Chart Patterns?
Chart patterns present a concise picture of all the buying and selling that is taking place in the trade market. So, you get a pictorial representation of the trading that is taking place, and gives you a framework to analyze the constant tiff between bulls and bears. So, you can position yourself better as a trader.
By analyzing chart patterns, you can make short, as well as long-term forecasts. The data used to create the chart patterns can be collated yearly, monthly, weekly, or even daily.
Types of Chart Patterns
When it comes to the chart patterns, there are mainly three categories-
- Continuation Patterns: It signals that an ongoing trend is going to continue
- Reversal Patterns: The pattern shows that the trend might be about reversing its direction
- Bilateral Chart: It lets you know that price might rise or fall, implying it is a highly volatile market.
Now, check out the ten chart patterns you can use for your technical analysis.
Top 10 Chart Patterns Cheat Sheet
-
1. Head and Shoulders
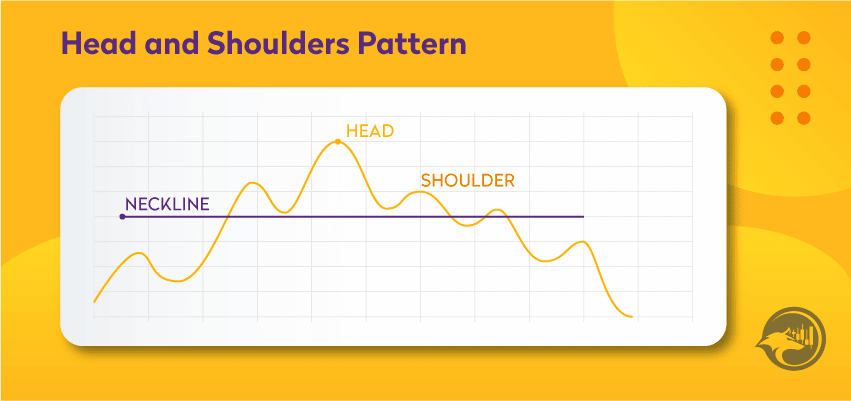
A pattern that has a large peak and then a tad smaller peak on either side is known as head and shoulders. You can take a look at this pattern to get an insight into bullish-to-bearish reversal.
Usually, the first and third are smaller than the second. However, they fall back to the same level of support or are called the neckline. As soon as the third peak falls back to the level of support, there is a chance it is going to take a course of a bearish downtrend.
2. Double Top
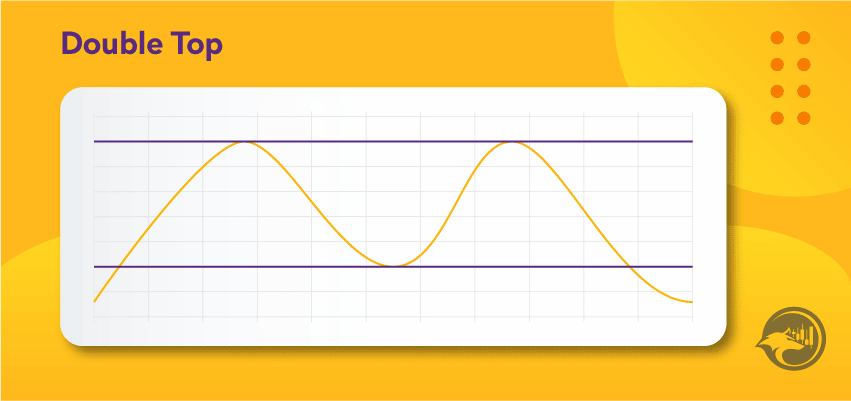
This is another bearish reversal pattern that is frequently used by traders. In this, you will notice the price of the asset peaking before retracing to a level of support. Thereafter, it will climb up yet again, prior to reversing back permanently against the existing trend.
3. Double Bottom
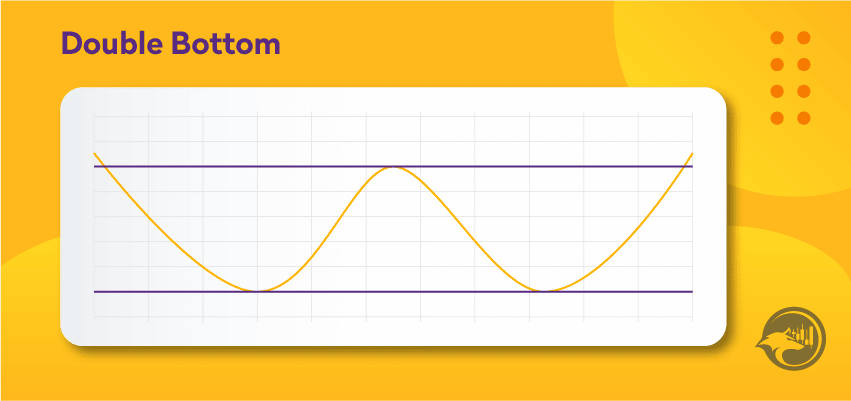
A double bottom chart pattern shows a period of selling, making the price of the asset drop below a level of support. Then it shows a level of resistance before showing a downward dropping trend, again. Ultimately, the trend is reversed and starts an upward motion since the market becomes more bullish.
So, this trend is a bullish reversal pattern as it is a sign of an end of the downtrend and a move to an upward trend.
4. Rounding Bottom
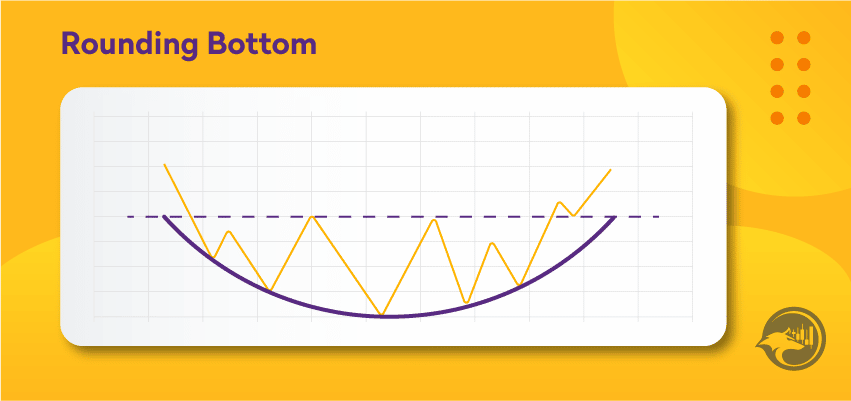
This pattern can manifest a reversal or continuation. For example, in an upward trend, the asset price might drop a little before it rises again. Thus, it can be a bullish continuation. The pattern is also called a Saucer Bottom. It shows that the trend is reversing to an upward trend from a downward one.
Traders might want to capitalize on this pattern by getting at the low point that is halfway around the bottom. They also capitalize on the continuation as soon as it breaks the level of resistance.
5. Wedges
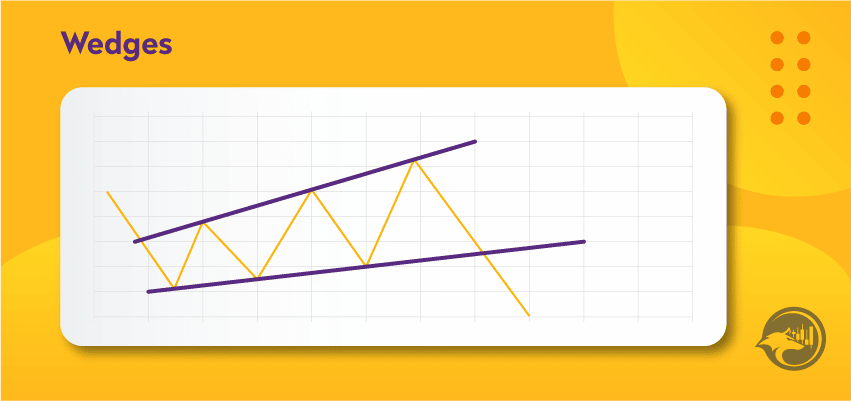
Wedges are bearish and bullish reversal patterns, which are formed by joining two trend lines, which converge. It shows the price movement of an asset tightening between sloping trend lines. When it comes to this pattern, there are two types- rising and falling.
A rising is the one in which a trend is found between two upward slanted lines of resistance and support. But the line of support is much steeper in this case than the resistance line. The pattern usually signals that the price of an asset will eventually drop more permanently, and it is shown as it breaks through the support level.
While a falling edge occurs between two levels sloping downward. Here the resistance is much steeper than the support. A falling wedge shows that the price rises and breaks through the level of resistance.
6. Cup and Handle
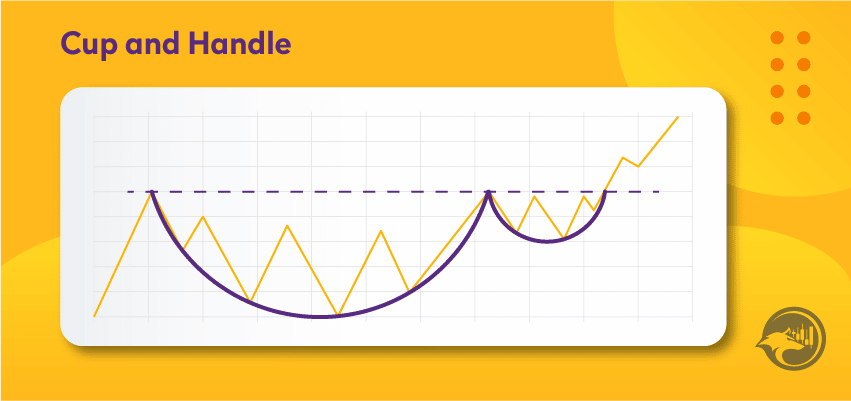
It is a bullish continuation pattern that shows the period of bearish market sentiment prior to the trend continuing in a bullish pattern. A round bottom chart pattern is the cap, while the handle is just like a wedge pattern.
After the rounding cup bottom, the asset’s price is more likely to step into a temporary retracement that is called the handle as the retracement is confined to two parallel lines shown on the graph. Ultimately, the asset reverses out of the handle and keeps with the bullish trend.
7. Flags or Pennant
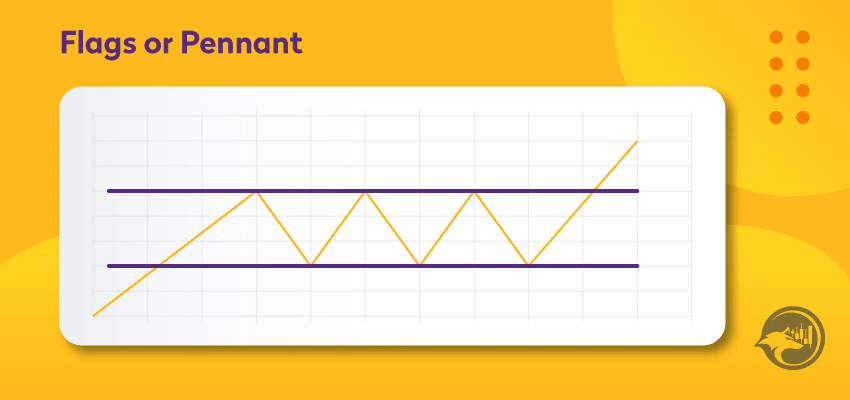
Flags or pennants have been created after an asset sees an upward movement, followed by consolidation. Usually, there will be a considerable increase in the early stages before entering into a sequence of upward and download trends.
This pattern can be either bearish or bullish and signify a reversal or continuation. You might feel that a pennant is similar to a wedge pattern, but you should know that the latter is narrower than pennants.
8. Symmetrical Triangle
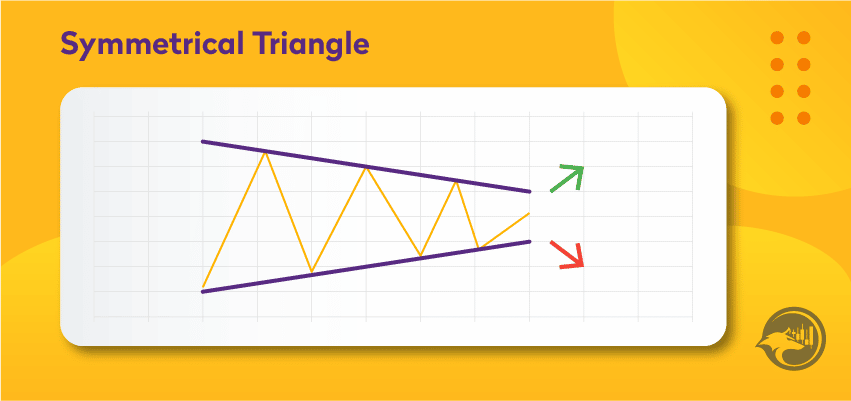
It is a pattern that can either be bearish or bullish, based on the market. Usually, it is a continuation pattern that means that the market is going to continue in the same direction as the trend after the pattern has already been formed.
The pattern is formed when the price converges with a sequence of higher troughs and lower peaks. But if there is no clear trend before the formation of the triangle pattern, the market might break out in either direction. Thus, symmetrical triangles are a bilateral pattern that can prove to be useful in a volatile market.
9. Ascending Triangle
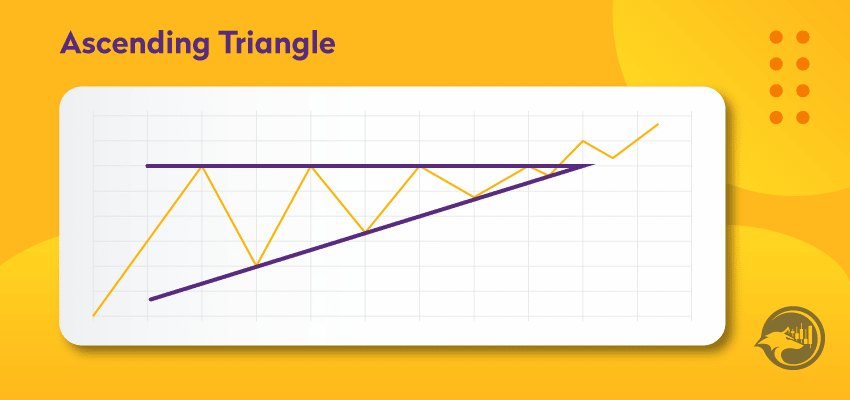
The ascending triangle pattern is a bullish continuation pattern that is a sign of the continuation of an uptrend. This pattern often has two or more identical peak highs that enable the horizontal line to be drawn. The trend line is a sign of an overall uptrend, but the horizontal line shows the level of resistance for that specific asset.
10. Descending Triangle
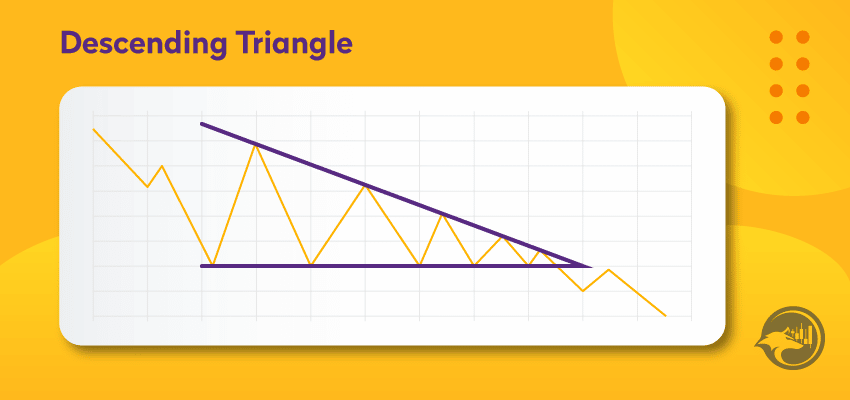
Like an ascending triangle, a descending triangle is a continuation chart pattern. But unlike the former, the latter shows a down-trending bearish continuation. Usually, a trader enters a short position in a descending triangle to make money from a falling market.
More often than not, descending triangle shift lower to break through the support. This is because it shows a market, which is dominated by sellers. So, successive lower peaks will be more prevalent.
Conclusion
The chart patterns will help you gauge why the asset price moved the way it did. Trading indicators and chart patterns can highlight the areas of support and resistance that will help you decide if you should open a short or long position.
In conclusion, chart patterns are a useful tool for traders to identify potential reversals and continuations in the market. There are various chart patterns that can be used by traders depending on the type of trend they want to capitalize on. Some of the most popular chart patterns are double top, double bottom, rounding bottom, wedges, cup and handle, flags or pennants, symmetrical triangle, ascending triangle, and descending triangle.