What is the head and shoulders pattern in Forex?
The head and shoulders pattern is a reversal pattern that can be found in both bullish and bearish markets. It gets its name from the fact that it looks like a human head and shoulders when viewed on a chart.
The pattern is created when there is a peak (the head), followed by a lower high (the left shoulder), and then another lower high (the right shoulder). This creates a “neckline” that can be used to predict where the market may reverse.
How to Identify Head and Shoulders Patterns in Forex
There are a few things you need to look for when trying to identify the head and shoulders pattern in the Forex market.
Bullish Head and Shoulders
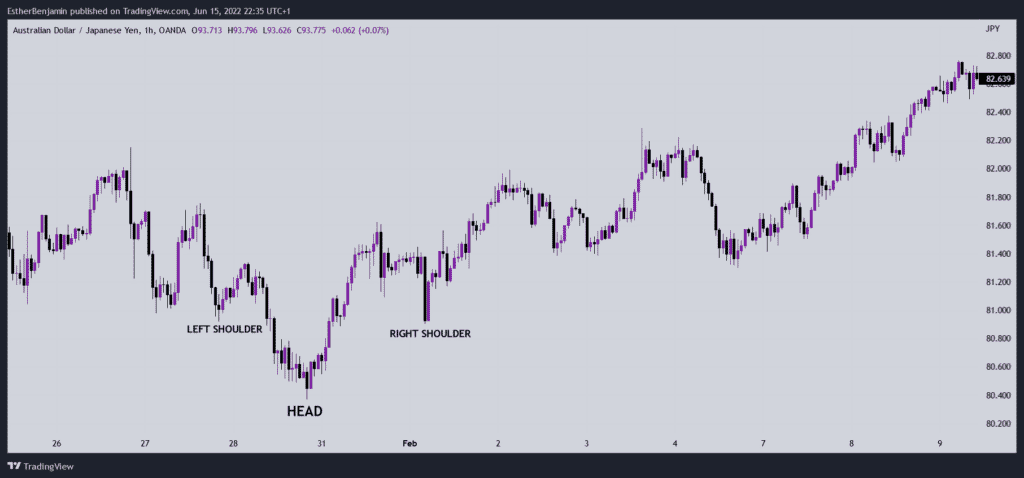
To identify a bullish head and shoulders pattern, here are 4 steps to look for on your chart.
Step 1: Identify the Market Trend
The first step is to identify the overall market trend. You want to make sure that you are looking at a chart that is in a downtrend. This is the only type of market where the bullish head and shoulders pattern is reliable.
Step 2: Look for the Left Shoulder
The next step is to look for the left shoulder. This will be a peak followed by a lower high. The left shoulder should be lower than the head, but higher than the right shoulder.
Step 3: Look for the Head
The head is the highest point of the pattern and is usually preceded by a brief period of consolidation.
Step 4: Look for the Right Shoulder
The right shoulder should be lower than the head, and is typically followed by a period of consolidation. Once you have found all three points, you can draw your neckline. This will be a line connecting the lows of the left shoulder and the right shoulder.
Bearish Head and Shoulders
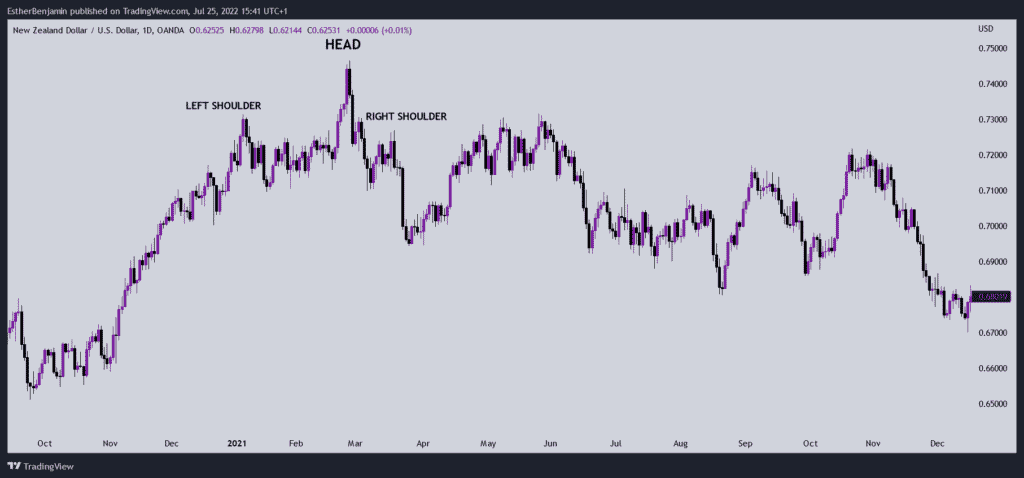
The steps for identifying a bearish head and shoulders pattern are the same as for a bullish pattern, but in reverse.
Step 1: Identify the Market Trend
The first step is to identify the overall market trend. You want to make sure that you are looking at a chart that is in an uptrend. This is the only type of market where the bearish head and shoulders pattern is reliable.
Step 2: Look for the Left Shoulder
The next step is to look for the left shoulder. This will be a peak followed by a higher low. The left shoulder should be higher than the head, but lower than the right shoulder(or equal to it).
Step 3: Look for the Head
The head is the lowest point of the pattern and is usually preceded by a brief period of consolidation.
Step 4: Look for the Right Shoulder
The right shoulder should be lower than the head, and is typically followed by a period of consolidation. Once you have found all three points, you can draw your neckline. This will be a line connecting the highs of the left shoulder and the right shoulder.
Is head and shoulders bullish or bearish?
The head and shoulders pattern is generally considered to be a bearish reversal pattern in a downtrending market, and a bullish reversal pattern in an uptrending market.
What Does a Head and Shoulders Pattern Tell You?
A head and shoulders pattern can give you a few different pieces of information about the market. For one, it can tell you when the market is likely to reverse. It can also give you an idea of how far the market may move once it reverses.
The neckline can be used to help predict where the market may reverse. The neckline is created by connecting the lows of the left shoulder and the right shoulder. In a bullish head and shoulders pattern, the neckline will be horizontal or rising. This means that the market is likely to find support at this level and then continue moving higher.
In a bearish head and shoulders pattern, the neckline will be horizontal or falling. This means that the market is likely to find resistance at this level and then continue moving lower.
The height of the pattern can also be used to predict how far the market may move once it reverses. This is measured by taking the vertical distance from the head to the neckline and projecting it down from the point where the neckline is broken. This gives you a target price for where the market may move to once it completes the reversal.
5 Reasons Why Forex Traders Should Use the Head and Shoulders Pattern
There are a few reasons why the head and shoulders pattern is such a popular tool among Forex traders.
1. The head and shoulders pattern is one of the most reliable reversal patterns.
Since the pattern is created by a shift in market sentiment, it is often an early indicator of a change in direction.
2. The pattern can be used to predict both the reversal point and the target price.
The neckline can be used to predict the reversal point, and the height of the pattern can be used to predict the target price.
3. The pattern occurs frequently in Forex markets.
This means that there are plenty of opportunities to profit from the pattern. If you are a scalper, you can trade this pattern on lower time frames like five or three minute charts. Swing traders can trade this strategy on higher time frame charts. This makes it highly versatile.
4. The pattern is relatively easy to identify.
Once you know what to look for, it is usually not too difficult to spot a head and shoulders pattern on a chart. The pattern appears on various timeframes and most traders can easily see the head and shoulders forming as market structure begins to shift.
5. The pattern can be used in conjunction with other technical indicators.
For example, many traders like to use the head and shoulders pattern in combination with support and resistance levels. For example, when a bearish head and shoulders occurs at a resistance level, this is seen as a confirmation that selling pressure could move prices lower.
3 Risk Factors to Look For in the Forex Head and Shoulders Pattern
The head and shoulders pattern is a reliable reversal pattern, but there are a few risk factors that you need to be aware of before you enter a trade.
1. False Breakouts
The first risk factor is false breakouts. This occurs when the market breaks out of the neckline, only to reverse and move back into the pattern. This can often lead to stop-losses being triggered prematurely.
2. Fake-out Patterns
The second risk factor is fake-out patterns. This is when the market looks like it is about to break out of the pattern, only to reverse and move back into the consolidation phase. This can often lead to traders entering a trade too early and getting caught on the wrong side of the market.
3. Divergence
The third risk factor is divergence. This is when the price action and the indicators are not in alignment. For example, if the price is making new highs but the indicator is making lower highs, this could make a head and shoulders pattern less reliable.
4 Tips in Dealing With Head and Shoulders in Forex
There are a few things that you can do to increase your chances of success when trading head and shoulders patterns in Forex.
1. Wait for a Confirmed Breakout
The first tip is to wait for a confirmed breakout. This means waiting for the market to close outside of the neckline before entering a trade. Here are 3 ways to avoid a false breakout;
- Wait for a candlestick to close outside of the neckline
- Use a longer time frame to confirm the breakout
- Look for confirmation from other technical indicators
2. Use a Stop-Loss
The second tip is to use a stop-loss. This will help you to protect your capital if the market reverses against you. A stop-loss should be placed below the lowest point of the right shoulder.
3. Take Profit at Previous Support or Resistance Levels
The third tip is to take profit at previous support levels. This will help you to maximize your profits if the market does continue in your favor.
4. Use a Risk-Reward Ratio of 1:2 or Higher
The fourth and final tip is to use a risk-reward ratio of 1:2 or higher. This means that for every dollar you are risking, you should be looking to make at least two dollars in profit.
How Can I Use the Head and Shoulders Pattern to Make Trading Decisions?
When it comes to making trading decisions, there is no one-size-fits-all approach.
Some traders like to wait for a confirmed breakout before entering a trade, while others may enter a trade on a breakout without confirmation.
It is important to remember that the head and shoulders pattern is a reversal pattern, which means that it is often an early indicator of a change in direction.
This means that if you are looking to enter a trade on the head and shoulders pattern, it is important to be aware of the potential risks involved.
false breakouts, fakeout patterns, and divergence can all lead to the market reversing against you.
However, if you are able to identify these risk factors and manage them effectively, the head and shoulders pattern can be a reliable tool for making trading decisions.
How Do I Combine Head and Shoulders with Other Strategies?
You can combine head and shoulders with other technical analysis tools to create a more complete trading strategy.
Some popular combinations include;
1. Trendlines
You can use trendlines to help you identify the overall trend of the market. If the market is in an uptrend, you would look for head and shoulders patterns that form at the end of a downtrend. If the market is in a downtrend, you would look for head and shoulders patterns that form at the end of an uptrend.
2. Moving Averages
You can use moving averages to help confirm the breakout of the neckline. For example, if the market breaks out of the neckline on a candlestick chart, you could switch to a moving average chart to see if the moving averages are in alignment.
3. Support and Resistance
You can use support and resistance levels to help you identify potential take profit levels. For example, if the market breaks out of the neckline and rallies up to a previous support level, this could be a good level to take profit.
4. Relative Strength Index
You can use the Relative Strength Index (RSI) to help confirm reversals. For example, if the market makes a new high but the RSI does not, this could be a sign that the market is about to reverse.
The head and shoulders pattern is a reversal pattern that can be used to make trading decisions in the Forex market.
When combined with other technical analysis tools, it can help you to identify potential entry and exit points in the market.
It is important to remember that the head and shoulders pattern is a reversal pattern, which means that it is often an early indicator of a change in direction. While using this pattern, make sure you wait for confluence, manage your risk, and follow a solid trading plan.