What is a Shooting Star Pattern?
It is a bearish candlestick pattern characterized by a long upper shadow and a small real body. The pattern forms when a security price opens, advances significantly, but then retreats during the period only to close near the open again. Consequently, the open and close price points are close to one another. The long upper shadow is usually twice the length of the candlestick’s real body.

The Shooting Star pattern is considered a bearish candlestick pattern as it occurs at the top of an uptrend and is typically followed by the price retreating lower. It is considered bearish because bears reject the high price point set by bulls during the trading period, consequently pushing the price lower, resulting in the closing price being near the opening price of the candlestick.
How to identify Shooting Star Candle
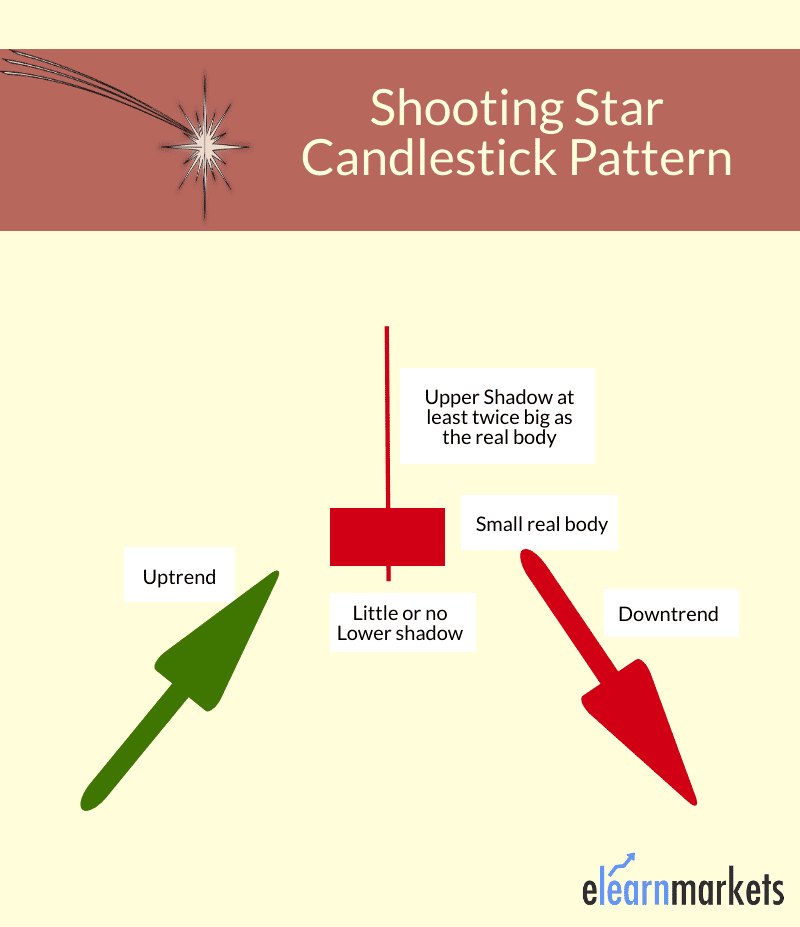
A pattern is considered a shooting star only if:
- It appears after a significant price advance and appears at the top of the uptrend.
- The candlestick has a long upper wick and a small real body
- The distance between the highest price point and the opening price must be more than twice the shooting star body
- There should be little or no shadow below the real body
Shooting Star Pattern Candlestick Psychology
It is more effective when it appears after three or more consecutive rising candles that form higher highs. However, it may also occur during periods of rising prices even if the recent candles were bearish. The appearance of the shooting star candlestick signifies price has topped and is likely to correct and start moving lower.
When the shooting star occurs, it first rises, implying the buying pressure experienced during the previous session is still in play. However, as the session or day progresses, short sellers enter the fray piling the pressure on the bulls.
The bulls or buyers struggle to push prices higher as more bears or short sellers enter the market and place short positions. The high of the long shadow acts as a resistance level, above which bulls struggle to push prices higher as bears enter the market. Consequently, prices start to edge lower as bears appear to be winning the battle. At the end of the session, the price retreats from the highs of the session and closes near the opening price.
The price retreats from the day’s highs imply buyers are losing control as the upward momentum fades. The fading could result in buyers exiting the market or placing more sell orders, thus countering the long positions. The long upper shadow or wick affirms buyers are in trouble as bears pile pressure and push the price lower.
How to Trade the Shooting Star Pattern
Once the shooting star pattern appears, it does not mean that one enters a short position immediately, even if it is a bearish candlestick. Instead, the candle that forms immediately after the pattern is what confirms whether a reversal is in play or it is likely to fail, and the price continues to move up.
The emergence of a strong bearish candlestick that opens and closes below the shooting star candle affirms bears are in control of the market. The next candle must gap lower and move lower on heavy volume to confirm a change of momentum from bullish to bearish.
If looking at the daily chart, the formation of a bearish candlestick after a shooting star pattern confirms price reversal. In this case, traders can look to enter short positions to profit as prices correct from the previous highs to new lows.
While the shooting star indicates that the price will likely move lowers, there is usually no guarantee of how far it will drop. Given that price is expected to bounce back and start moving up, it is essential to use a stop loss order while trying to trade reversals with this pattern.
The stop loss order helps manage the risk if the original plan does not work as intended. In addition, it will help avert losses accumulation should the price bounce back and start moving up.
Nevertheless, there are cases where the price rises after the shooting star candle emerge. If the high of the pattern acts as resistance and the price fails to move up, the level would be considered a strong resistance level. Traders can place short positions at this level with a stop loss order a few pips above the shooting star highs.
If the price continues to move up and closes above the shooting star highs, it means the uptrend is still intact and that prices are not expected to edge lower as part of the bearish reversal pattern. Such a setup is often referred to as a failed bearish reversal, as bears are overpowered by bulls coming back into the market and pushing the prices higher.
How to Trade Shooting Star
Before opening trade after a shooting star pattern, it is essential to remember the following points:
- The previous trend before the emergence of the shooting star pattern should be bullish.
- Only open a trade after a confirmation candlestick after the shooting star pattern asserts bears are in control.
- Always place a stop loss a few pips above the highs of the shooting star candle
Shooting star Example
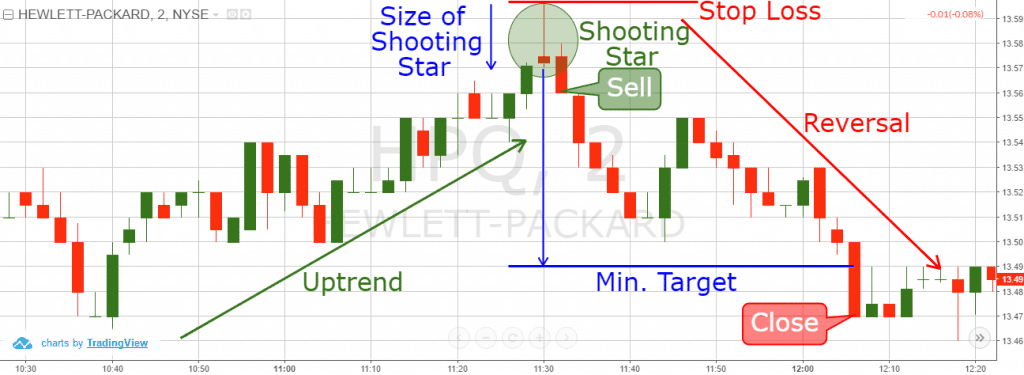
The daily chart above shows stock prices rose during the first phase. Afterward, a shooting star candle appears at the top after the significant price advance. The pattern shows prices opened and went higher but closed lower at the end of the day resulting in a long wick and small body. The emergence of a bearish candlestick the following day affirms that momentum had changed from bullish to bearish on bears overpowering the bulls.
Afterward, price tanks, and while it tries to rise in the next few days, it struggles to rise above the shooting star highs affirming the bearish momentum. The setup allowed traders to enter short positions as soon as the bearish candlestick occurred after the shooting star pattern.
Shooting Star and Confirmation Candle
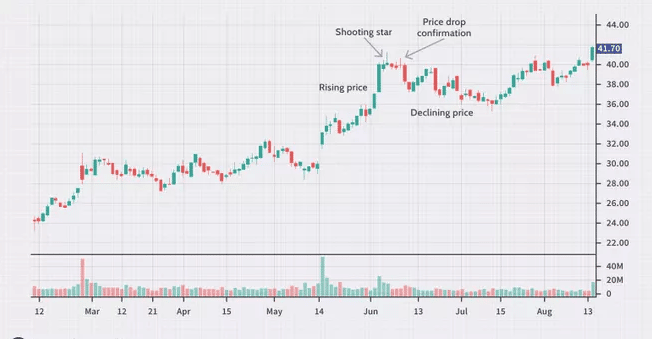
The shooting star pattern can occur during periods when bulls appear to be in total control, with prices likely to continue edging higher.
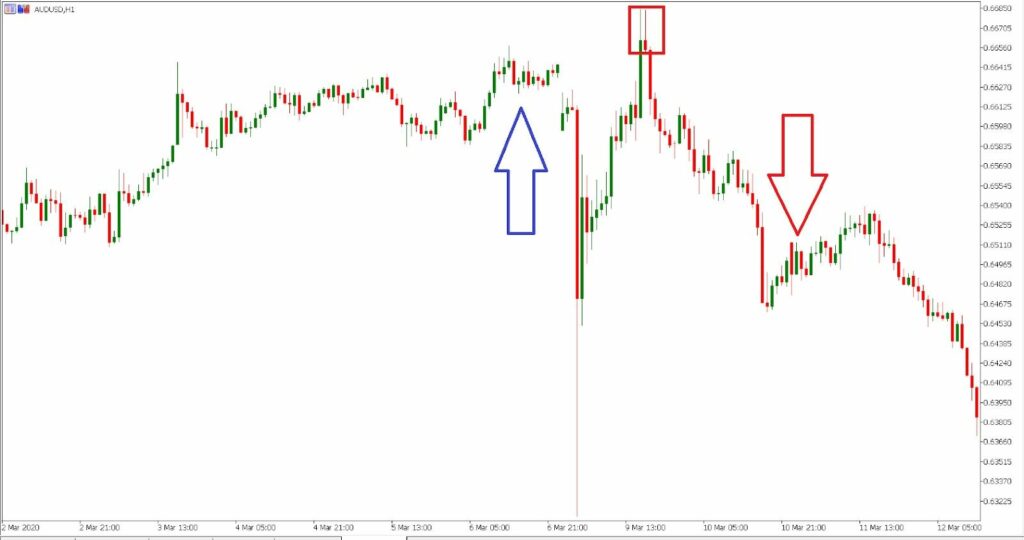
In the chart above, the shooting star candle appears after a big bullish candle that implies bulls are in control and pushing prices higher. However, the bulls fail to push the price above the previous high, with the shooting star candle closing slightly below the previous close.
The emergence of a more bearish candle after the shooting star candle asserts a change in momentum from bullish to bearish. Afterward, the price tanks with force, signaling the bearish reversal. Traders who opened short positions after the close of the confirmation candle ended up accruing significant pips as the price tanked significantly.
Shooting Star Forex
The shooting star pattern can occur when trading any security from forex to commodities and even stocks. It is not limited to a particular instrument as it is a function of trader’s sentiments and price action.
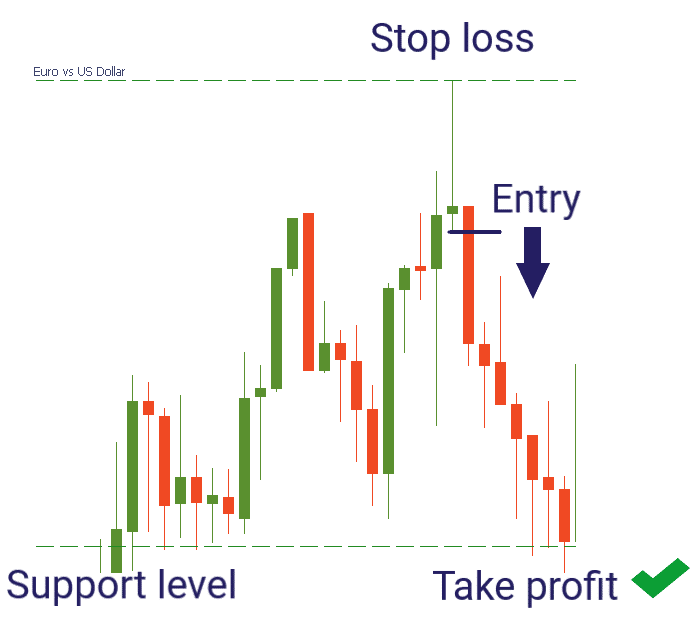
The shooting star pattern would provide a more accurate trading signal when it occurs near a resistance level when trading forex. Its appearance, in this case, will imply bulls are exiting the market as they do not expect the price to move above the level. The resistance level also allows one to try and sell the market at highs.
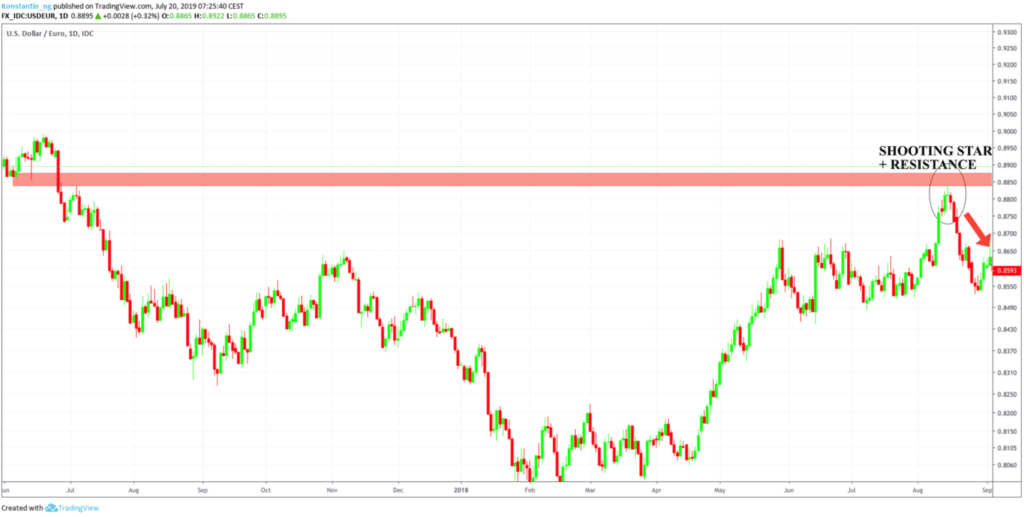
The USD/EUR chart above shows the apparent price in an uptrend after bottoming out from the base. However, upon rising close to the resistance level, the upward momentum fades, and the emergence of a shooting star pattern affirms a potential reversal as bulls don’t expect the price to rise any further.
What follows is price tanking from the highs. The resistance level acted as an ideal area to watch for a potential bearish reversal, with the shooting star pattern conforming. Therefore while trading any security, it is essential to be aware of any resistance level if one wishes to identify reversal patterns as the one above
Shooting Star Pattern and Relative Strength Index
The Relative Strength Index is a vital momentum indicator that indicates levels where the market is overbought or oversold. Readings above 70 imply market overbought, while readings below 30 assert oversold conditions.
When it comes to ascertaining bearish reversals, overbought conditions are of utmost importance. The shooting star pattern appearing as soon as the RSI moves above the 70 levels and into overbought territories should be a warning sign of potential price reversals.
It is common for the market to reverse as soon as prices are deemed overbought, as very few buyers are willing to buy at this level.
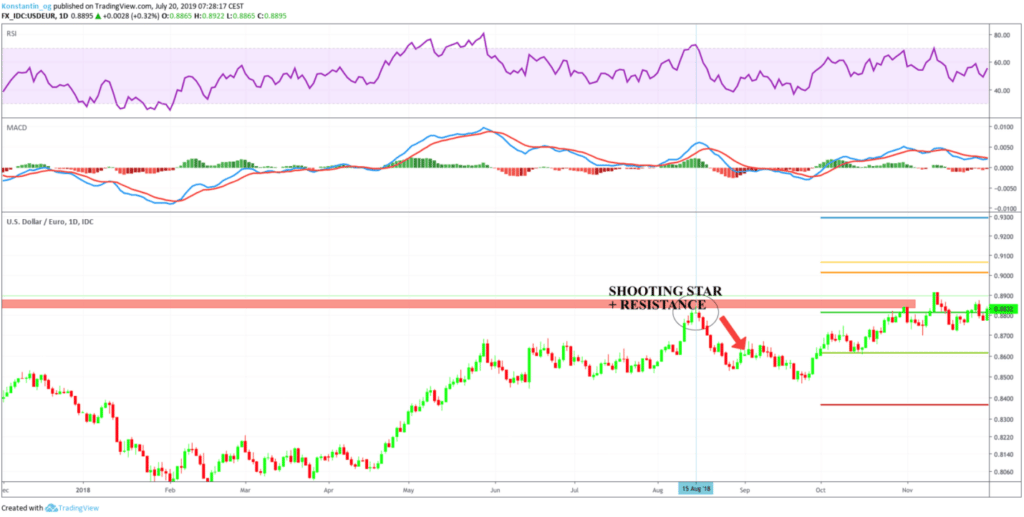
The chart above clearly shows that the shooting star pattern emerges as soon as the RSI reading is above 70, asserting overbought conditions. The pattern forms at an area of strong resistance indicate that the price is likely to edge lower from the bullish setup.
Shooting Star vs. Inverted Hammer
The shooting star candle and the inverted hammer share a significant attribute. Both come with long shadows or wick and small bodies. However, they differ depending on when they occur and the trading signal they imply.
The shooting star is a bearish reversal candlestick that appears after a significant price advance. Therefore, it appears at the top of an uptrend suggesting that the price has peaked and the upward momentum is waning.
In contrast, the inverted hammer is a bullish reversal candlestick pattern that occurs at the bottom of a downtrend. The inserted hammer indicates that the price has bottomed out and is likely to move higher as part of an emerging bullish momentum.
Shooting Star Success rate
The shooting star reversal candlestick boasts a success rate of about 69% when predicting bearish reversals from an uptrend. However, the low success rate indicates it cannot be relied on its own to provide accurate reversal signals. Therefore, it is essential to use other indicators and candlestick formations to confirm whether a reversal is about to occur instead of basing all trading decisions on the single candlestick.
Shooting Star Candlestick Limitations
Like any other candlestick pattern, the shooting star pattern cannot be used in isolation to make a trading decision. The pattern does not provide accurate insights for trading price reversals on its own. Therefore, it should always be used with other indicators or confirmation candles.
For instance, the pattern can imply a reversal is about to happen, for the price to bounce back after the pullback and continue moving up in the continuation of the underlying bullish uptrend. Therefore, it is essential to use stop loss orders to control losses should the reversal fail to hold, and the price continues moving up.