Understanding Three White Soldiers Candlestick pattern
Three White soldiers is a bullish candlestick pattern. It occurs when the price has moved lower significantly as part of a downtrend and starts to bounce back after hitting a level of strong support. Therefore, it appears at the bottom of a downtrend.

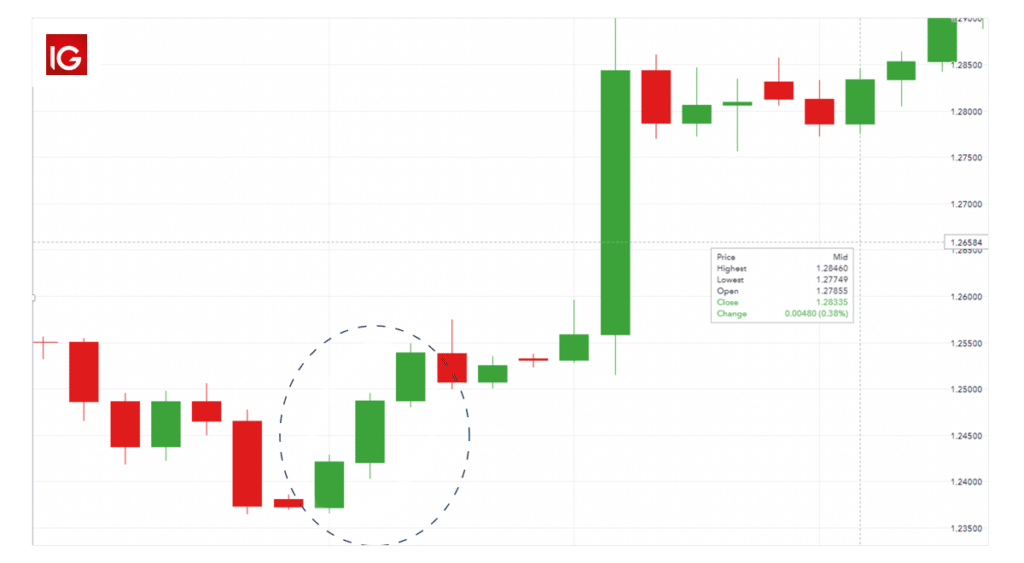
The bullish candlestick pattern consists of three bullish candles. To identify the pattern, look for three consecutive bullish candlesticks that close higher. In this case, the candle might open within the previous candle’s body but must close higher.
The candles must also have big bodies and small wicks, affirming a buildup in buying pressure with the entry of bulls into the market. The pattern creates a staircase-like structure as the price increases, resulting in higher highs.
The chart above clearly shows that once the first bullish candlestick appeared, the second and the third candles opened and closed higher. However, the candlesticks also have small wicks signaling little or no resistance from short sellers to try and push the price slower.
How to identify the three white soldiers candlestick pattern
- The market must be in a downtrend, with prices making lower lows
- The emergence of three long and bullish candlesticks
- Each candle opens and closes higher, resulting in a staircase-like structure
- The candles must have small or nonexistent body wicks
What Does Three White Soldiers Pattern Imply?
The three white soldiers candlestick pattern suggests a significant change in market sentiment. While initially, the price was moving lower, implying strong selling pressure, the emergence of three bullish candlesticks affirms that bulls have overpowered bears, and market momentum has turned bullish from bearish.
The pattern indicates weakness in the long-term downtrend and the potential emergence of an uptrend as the bear’s exit the market. It also implies that bears are exiting the market after pushing prices lower and reaching a point of strong support.
As the price closes with small or no shadows, it affirms that bulls are managing to keep the price at the top of the range with limited or no opposition from short sellers. The big candlestick bodies indicate a steady advance in buying pressure on a buildup in volume.
How do you trade 3 white soldiers?
The three white soldiers is a reliable entry and exit signal. Traders who are short in the market exit the market as soon as the three bullish candlesticks appear, indicating that momentum is shifting to the upside. Their appearance affirms that the momentum has changed from bearish to bullish. Consequently, it would not make sense to remain bearish as the price is likely to increase.
Similarly, bulls on the fence, as the price was moving lower, interpret the three white soldiers as a buy signal as the trend reverses from a downtrend to an uptrend. Consequently, they use the opportunity to eye buy positions as the price is likely to move up with a buildup in buying pressure.
While the pattern provides reliable entry and exit signals, it is essential to use other indicators to confirm the same. Consequently, technical analysts rely on momentum indicators to ascertain whether the momentum has changed from bearish to bullish.
The Relative Strength Index (RSI) is one indicator commonly used alongside the three white soldiers candlestick patterns. The indicator has readings between 0 and 100. When its readings are below 30, it implies oversold conditions, and readings above 70 imply overbought conditions. Therefore, while analyzing the three white soldiers, the RSI being below 30 is of utmost importance as it provides an early signal of potential price reversal.
Consequently, when the RSI readings start moving up from below the 30 levels as the three white soldiers emerge, it affirms the momentum shift from the downside to the upside. The RSI closing above the 50 levels affirms that the market has changed from bearish to bullish and that price will likely continue increasing.
When trading the candlestick pattern, it is essential to note that a strong move up could result in a temporary overbought condition. For instance, when the RSI moves above 70 levels, it implies that the market is overbought. Therefore, while the price can continue moving higher in mid-overbought conditions, caution is of utmost importance.
The likelihood of the price starting to move lower after the overbought conditions are met is usually high. However, in this case, the pullback might be small before the price moves higher in continuation of the emerging uptrend.
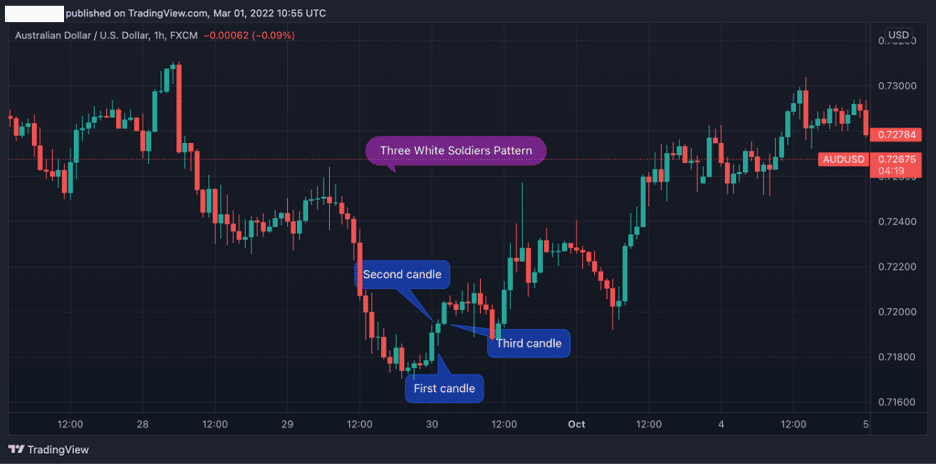
Three White Soldiers example
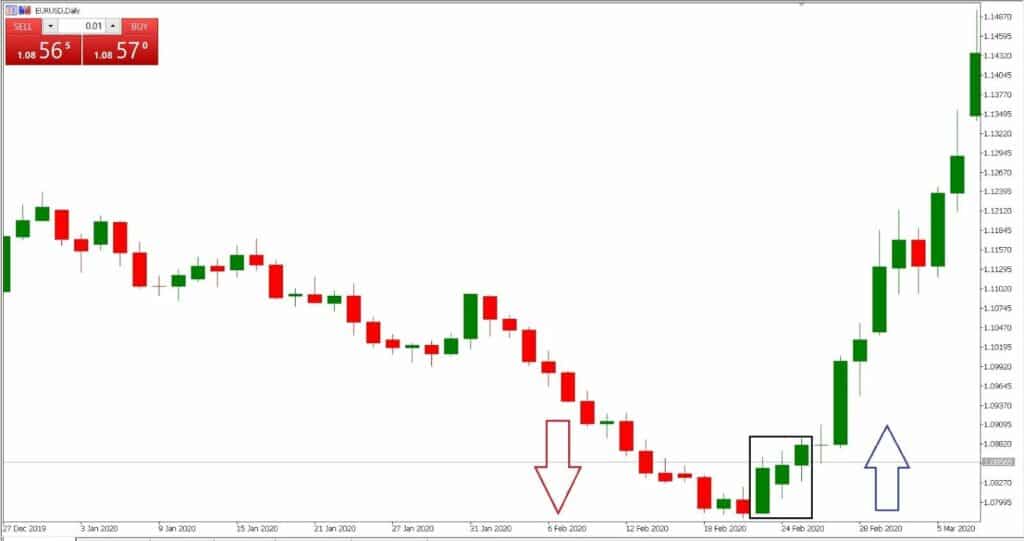
The chart above clearly shows that the EURUSD pair was moving lower in the first phase. However, upon hitting a strong support point, a strong bullish engulfing candlestick emerges. The bullish engulfing candle signals bull’s entry into the market and waning short selling pressure.
Once the first bullish candle closes, another bullish candle occurs with a big body that emerges and closes above the previous high. The formation of the third bullish candle that closes above the second candle affirms the three white soldiers pattern.
The formation of the three white soldiers affirms bears have been overwhelmed and that price has reversed course and is likely to continue moving higher. In this case, bulls entered a buy position once the third candle closed, anticipating price edging lower.
The stop loss order can be placed a few pips below the first candle of the three white soldier’s pattern. The stop loss order will avert the risk of increasing losses on price, reversing course, and moving lower in continuation of the previous downtrend.
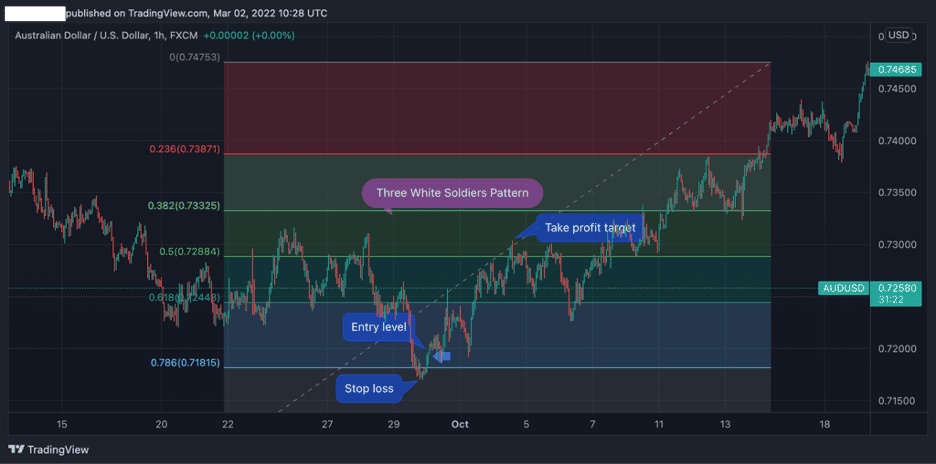
Example 2 Three White Soldiers and Relative Strength Index
The three white soldiers become a reliable candlestick pattern for trading price reversals when used with momentum indicators such as the Relative Strength Index and the stochastic indicator.
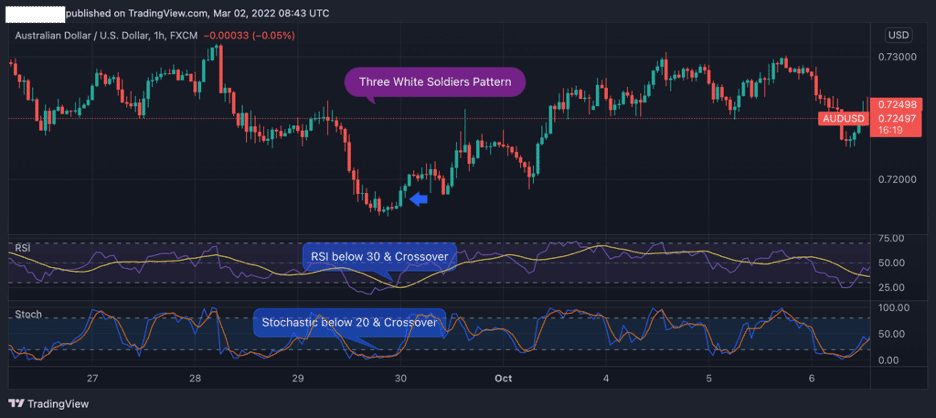
In this case, the RSI and the stochastic are used to determine when the market has entered an oversold condition. Such conditions tend to attract bulls and act as a strong area of price reversal.
In the chart above, it is clear that bullish candlesticks started appearing on the chart as soon as the RSI was below 30, signaling oversold conditions. It was also the case as the stochastic reading was below 20, affirming the oversold conditions.
As the RSI and the stochastic started moving up, scaling above the 30 and 20 levels, respectively, the second bullish candle as part of the three white soldiers’ pattern appears. It is clear that AUDUSD continued to move higher as the RSI and stochastic moved up, affirming the bullish momentum in the market.
In the above setup, a trader would have triggered a long position when the third candle of the three white soldiers emerged, and the RSI and the stochastic were above 30 and 20 levels, respectively. The stop-loss order to protect against the continuation of the long-term downtrend would have been placed below the first bullish candlestick at the base of the three white soldier patterns. The take profit would have been placed a few pips below the highest level of the previous bearish trend.
Three White Soldiers and Fibonacci Retracement
In addition to using momentum indicators to time entry and exit levels using the three white soldier patterns, the Fibonacci tool can also come in handy. For example, the tool could greatly help detect areas of strong support and resistance level as the price moves up from the downtrend.
The Fibonacci retracement tool can be drawn from the highest level of the downtrend to the lowest level where price reversal occurred. Once the tool is drawn, and the three white soldiers occur, one can enter a long position and time the exit level as price trades above the 78.6% level on price moving up.
The stop loss can be placed a few pips below the Fibonacci retracement tool as that level acts as strong support below which price is expected to continue moving lower in continuation of the long-term downtrend. The take profit can be placed a few pips below the previous high of the downtrend.
Three white soldiers’ success rate
The three white soldiers is one of the most reliable trend reversal patterns. Based on studies, the bullish reversal pattern provides s accurate signals 80% to 90% of the time. Consequently, when the three bullish candles occur, there is always an 80% probability that the price will reverse course and start moving higher.
The pattern is even more reliable and accurate when combined with other technical analysis tools such as the relative strength index and the stochastic index. Likewise, whenever the pattern occurs and the price moves above the 200-day moving average, there is always a high chance of the price reversing course and moving higher, affirming the start of an uptrend.
The three white soldier patterns are not common in trading charts. Studies have shown that the pattern occurs in nearly one in every 3,000 candles. Nevertheless, the pattern is fairly reliable for a bullish reversal candlestick pattern due to its rarity. Therefore, when the pattern occurs, it can be relied upon to provide reliable entry and exit signals.
It is also a more reliable candlestick pattern since it usually has no gaps. The next candle always opens within the previous candle’s body and closes slightly higher. If there are gaps in between the three gaps, then the pattern is invalid and cannot be a three-white soldier’s pattern.
Three White Soldiers Limitations
One of the biggest limitations of three white soldiers is that it can occur during periods of price consolidation after a strong move lower. In this case, the price might appear to have reversed course and start to move up only to reverse course and move lower in continuation of the long-term downtrend.
It is important to watch volume to avoid being trapped on price reversing course from the emerging uptrend and start moving lower. Once the three white soldiers’ candlestick occurs, they should be accompanied by strong volume affirming a buildup in buying pressure. Suppose the pattern occurs in a level of strong resistance and low volume. In that case, it is important to wait for further confirmation as the price’s likelihood of lower prices is usually high.
If the volume is low, it simply implies that short sellers are only taking profits and that price is likely to decrease once it bounces up significantly. The bounce back often allows short sellers to enter new positions at the new highs.
In addition, it is important to use the pattern to make a trading decision in combination with other technical indicators. The indicator should never be used in isolation. For instance, the relative strength index will provide valuable information on whether the price is likely to continue moving up once the patterns occur. If the RSI struggles to move above the 50 levels, it simply implies the momentum is still bearish and that price will likely continue moving lower.