There’s a lot of buzz around VWAP trading strategies for a good reason! Distance from VWAP is a key metric for traders to understand. By understanding the behavior of prices relative to VWAP, traders can develop more effective trading strategies.
In this blog post, we’ll discuss what VWAP is and how you can use it to trade with more precision and confidence. We’ll also explore the concept of distance from VWAP and show you how to use it to your advantage in the markets. Stay tuned – learning about VWAP will help take your trading skills up a notch!
What is Volume Weighted Average Price (VWAP)?
The VWAP is a reference point for traders that shows the average price of an asset depending on the volume traded that day.
To calculate VWAP, you first need to determine the price of every trade and then multiply it by the number of shares traded for that particular transaction. This will give you the total value traded for the security.
After calculating the value traded, you need to divide it by the total number of shares traded for the day. The resulting number is the VWAP for that particular asset.
You can also use VWAP to assess where your order will likely be filled. This is based on the fact that if you place an order at a price that is very far from the current VWAP, your order will likely not be filled because there will be very few market participants willing to trade at that price.
If you place an order at a price very close to the current VWAP, it is much more likely that your order will be filled.
On the other hand, if you place an order near the current VWAP, it is more likely that your order will get filled as there will be more market participants willing to trade at that price.
In summary, VWAP is a useful benchmark that traders can use to assess where their orders are likely to get filled. It is also a good measure of the average price of a security.
How Does This Strategy Work?
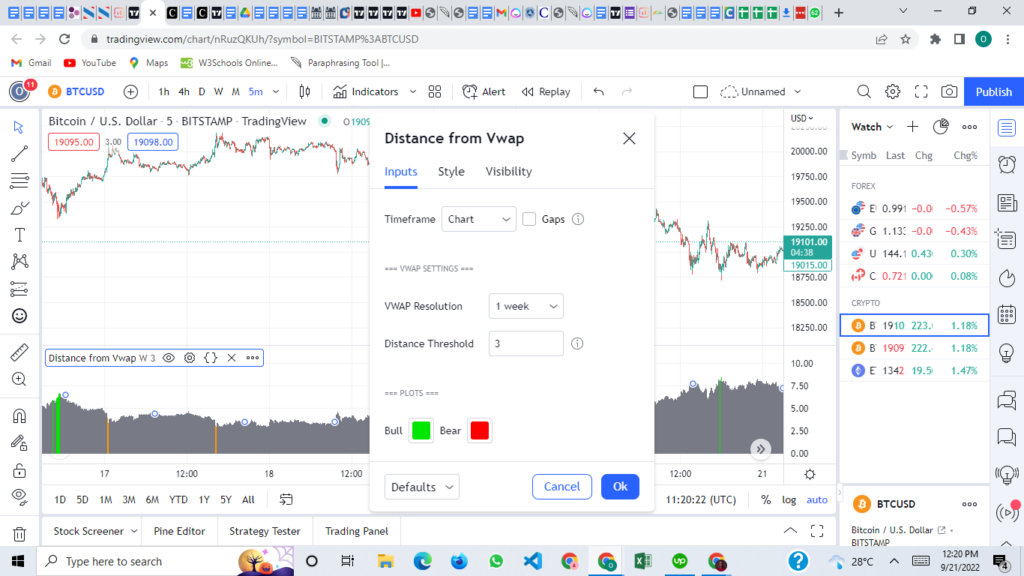
The distance from the VWAP strategy calculates the extent by which the current price differs from the Volume Weighted Average Price (VWAP) calculated over a longer period of time. In order to determine a threshold, one must first examine the bars that came before it, then record the values that were highest and lowest.
If the distance from the VWAP exceeds that level, the histogram will become green to indicate that the price is higher than the VWAP, and it will turn red to indicate that the price is lower than the VWAP. You will see that the histogram flashes orange in the event that the distance from the VWAP crosses the low threshold.
When you plot VWAP on your chart, you have the option of using it as an indicator of either support or resistance. If the price is trading higher than the VWAP, then there may be bullish momentum in the market. If the price is trading lower than the VWAP, then there may be bearish momentum in the market.
You can also use VWAP to take trades when the price returns to the mean after being extended away from it. When the price is extended away from VWAP, you can expect it to revert towards it.
You can take a trade when this happens by buying (or selling if bearish) when the price returns to VWAP. When trading with VWAP, you should also consider the possibility of employing a multi-timeframe strategy.
This means using VWAP on a longer timeframe, such as the daily chart, to give you an idea of where major long-term institutional traders are likely to accumulate or distribute their positions throughout the week and then looking for opportunities to enter a lower time frame, such as the 5-minute chart.
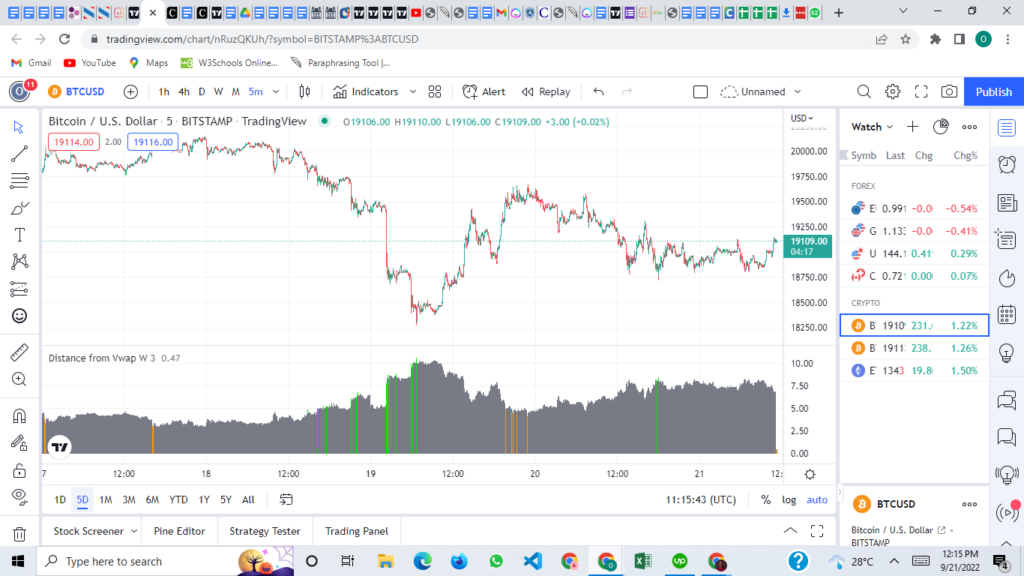
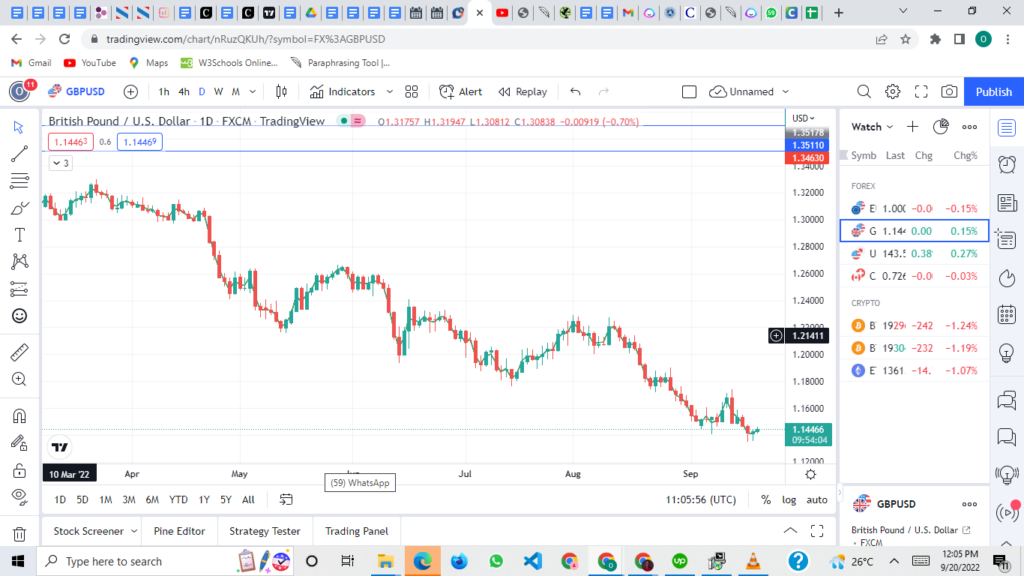
Setting Up Distance from VWAP
If you’re looking to set up a VWAP, there are a few things you’ll need to keep in mind. First, you’ll need to decide on the timeframe that you want to use for the indicator. Second, you’ll need to choose the timeframe you want to use for the VWAP.
It is recommended to use a higher timeframe VWAP as they tend to be more respected. For example, in the hourly time frame, I use the weekly VWAP. For the 1-minute timeframe, you may want to use the 4-hour timeframe, but feel free to experiment.
As soon as you have a handle on these two factors, you will be well on your way to setting up a VWAP tailored to your needs and preferences.
How To Use the Distance from VWAP to Your Advantage in the Markets?
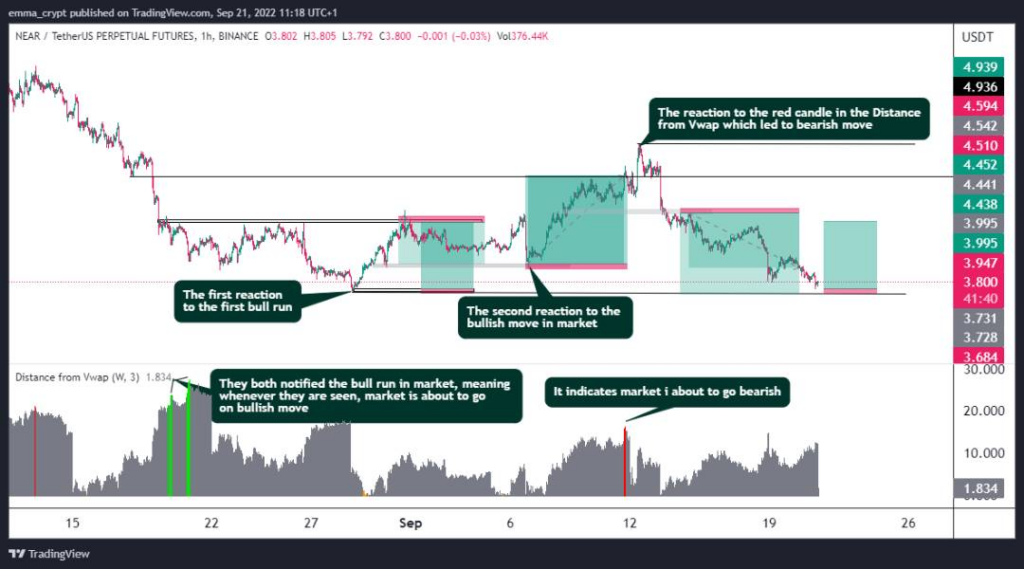
When the histogram is flashing green, prices are pulling far away from the VWAP. You don’t want to be buying a falling knife, but if you have levels of confluence, this can help spot reversals.
It is essential to wait until the first candle after it’s been green to get confirmation of the fall weakening. The same process goes for red histograms and shorts/sells.
When you see orange flashes, this shows that the price has been consolidating, and the price is very close to the higher time frame VWAP, which could be considered a safe entry point as they tend to lead to a big move to follow.
While VWAP is a useful metric, it’s important to remember that it’s just one tool in a trader’s toolbox. As with any technical indicator, VWAP should use other indicators and tools, such as price action and volume, to make more informed trading decisions.
Advantages of VWAP
Traders and analysts use the volume weighted average price (VWAP) to eliminate day-to-day variations and obtain a more accurate picture of the amounts at which buyers and sellers are trading on a stock or in the market.
This helps them make more informed trading decisions. For some investors, VWAP is the deciding factor in whether or not a stock is a smart buy on a given trading day. Among the advantages of utilizing VWAP are:
- VWAP helps to take the emotion out of trading. When a trader sees a stock moving higher or lower throughout the day, it can be difficult to keep emotions in check. Traders can gain a more accurate picture of what’s going on with stocks and make more informed judgments about when to purchase or sell if they use the VWAP indicator.
- VWAP can help determine whether a stock is undervalued or overvalued. If a stock is trading below VWAP, it may be considered undervalued, while if it’s trading above VWAP, it may be considered overvalued. When it comes to valuing stocks, the VWAP can be a useful tool; however, other aspects must also be taken into consideration.
- VWAP can help you trade with the trend. If a stock is consistently trading above its VWAP, it’s likely in an uptrend, while if it’s consistently trading below its VWAP, it’s likely in a downtrend. This can be helpful information for deciding whether to buy or sell a particular stock.
Limitations to VWAP
- As any trader knows, VWAP is a single-day indicator that restarts at the opening of each new trading day. This can be difficult for those trying to produce an average VWAP over several days, as it can distort the indicator and result in false readings. Those trying to create an average VWAP over several days may find this difficult.
- It’s anchored to the opening price range of the day.
- It doesn’t have predictive qualities or calculations.
Despite its limitations, VWAP is a useful tool for intraday traders and institutions seeking to fill large orders without significantly affecting the price. It can provide a good reference point for where the market was trading during the day and may help indicate whether the current price is high or low in relation to this average.
Strategies Used With VWAP
WAP trading is a popular strategy among traders of all experience levels. VWAP, or volume weighted average price, is a technical indicator that calculates the average price of a security over a certain time frame.
VWAP is calculated by taking the sum of all traded prices and dividing them by the total volume traded. VWAP is a popular tool among day and swing traders alike, as it can identify both entry and exit points in a security.
VWAP strategies can be broadly classified into three categories: the VWAP pullback, the VWAP “hold & go” pattern, and fading to VWAP.
The VWAP pullback is a common strategy among day traders. The VWAP pullback occurs when the price of a security rallies above VWAP and then pulls back to retest VWAP support. This pullback usually provides an opportunity to enter long positions.
The key to this strategy is identifying when the rally above VWAP is likely to occur. This can be done by looking for price patterns such as breakouts from consolidation or momentum indicators such as moving average convergence divergence (MACD).
The VWAP “hold & go” pattern is another common strategy among day traders. This strategy is based on the idea that stocks tend to “hold” at VWAP following periods of heavy buying or selling pressure.
VWAP can be used as a level of support or resistance. The key to this strategy is identifying when buying or selling pressure will likely ease, allowing the stock to “hold” at VWAP. This can be done by looking for price patterns such as consolidation or momentum indicators such as the relative strength index (RSI).
Fading to VWAP is a contrarian strategy involving shorting a stock when it rallies above VWAP and then buying back the position when it fades below VWAP. This strategy exploits the tendency of stocks to overshoot to the upside and downside following periods of heavy buying or selling pressure.
The key to this strategy is identifying when buying or selling pressure will likely ease, allowing the stock to “fade” below VWAP. This can be done by looking for price patterns such as consolidation or momentum indicators such as the relative strength index (RSI).
While there are many different VWAP trading strategies, these three are among the most popular. Each has its own strengths and weaknesses, so choosing the right strategy for your individual trading style and risk tolerance is important.
What is Anchored VWAP
An anchored volume-weighted average price (VWAP) is a type of technical indicator that plots the volume-weighted average price of a security for a given length of time. The time period can either be anchored or be user-defined, and it can begin at any place on the chart that the user chooses.
To put it another way, anchored VWAP displays the price of the asset modified for its volume beginning at any point on the chart that the user chooses.
This technical indicator is helpful for investors in determining the typical price of a security over a given time frame. An anchored VWAP can also help identify trends and support and resistance levels.
To calculate the anchored VWAP, the volume-weighted average price is first determined for the security over the specified time period. The result of this comparison is used to determine whether a buy or sell signal should be generated for a security.
Anchored VWAP is a popular technical indicator among traders and is available on most trading platforms.
The Difference Between VWAP And Anchored VWAP
The traditional VWAP is the basis for calculating the anchored VWAP, which uses the same formula. The only thing that’s different about the computations is the bars that are taken into account.
The computation for a standard VWAP begins with the first bar of the trading day and continues until the last bar of the trading day. However, VWAP’s calculation period is anchored around a specific time or price.
Conclusion
In conclusion, the distance from VWAP is a crucial metric for any trader to consider when making decisions. By understanding how to trade around this key level, traders can improve their results and take their trading to the next level.
While there is no one perfect way to trade the distance from VWAP, the strategies outlined in this article provide a solid starting point. By combining these methods with other technical indicators, traders can develop a comprehensive approach that will help them achieve optimal results.