What is the Heikin Multi-Time Frame Strategy?
The Heikin-Ashi technique is a form of candlestick charting that filters out some of the noise in price action. It does this by taking an average of the open, high, low, and close prices over a certain period of time. This makes it easier to identify trends and spot potential reversals.
The strategy is based on the premise that market prices move in waves, and by using multiple timeframes, traders can identify the direction of the entire trend and trade accordingly.
The Heikin Multi Time Frame Strategy uses three different timeframes: a short-term timeframe to identify entry and exit points, a medium-term timeframe to confirm the trend, and a long-term timeframe to determine the overall market direction.
Traders who use this system will typically enter into trades in the short-term timeframe and then hold onto their positions for the duration of the trend in the medium-term timeframe. Once the trend has reversed in the long-term timeframe, they will exit their trades.
The Heikin Multi Time Frame Strategy can be applied to any financial market, including stocks, commodities, forex, etc. It can also be used at any time, although most traders use it on hourly or daily charts.
The key to successful trading with this system is to focus on quality over quantity; rather than trying to trade every move in the market, focus on finding high-quality trades that fit the overall trend. If done correctly, the Heikin Multi Time Frame Strategy can be a highly effective way to trade the financial markets.
How Does the Heikin Multi-Time Frame Strategy Work?
The Heikin Ashi Close is the average of the current period’s open, close, high, and low prices and the prior Heikin Ashi candlestick. The Heikin Ashi Close will ultimately differ from the traditional candlestick Close.
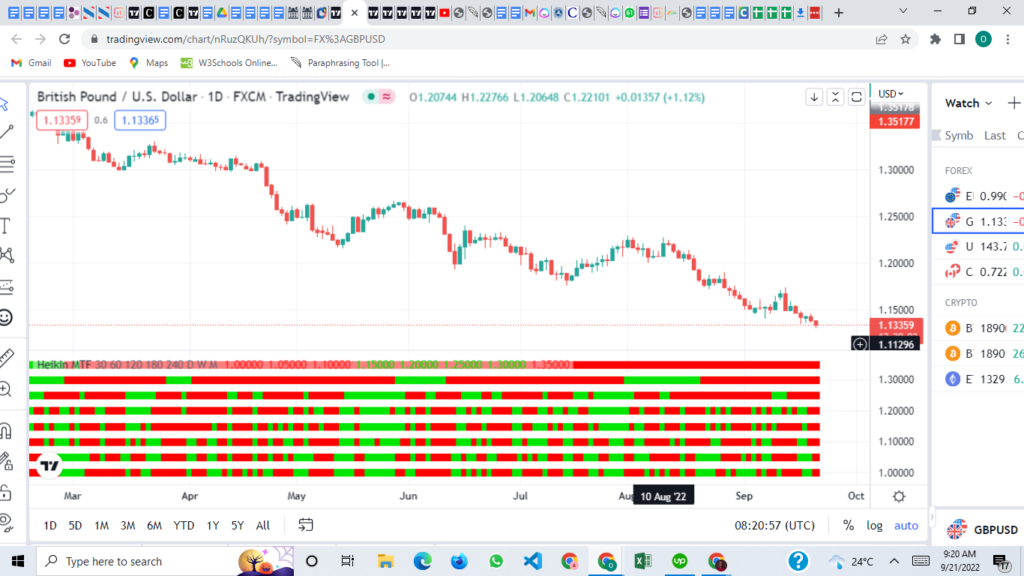
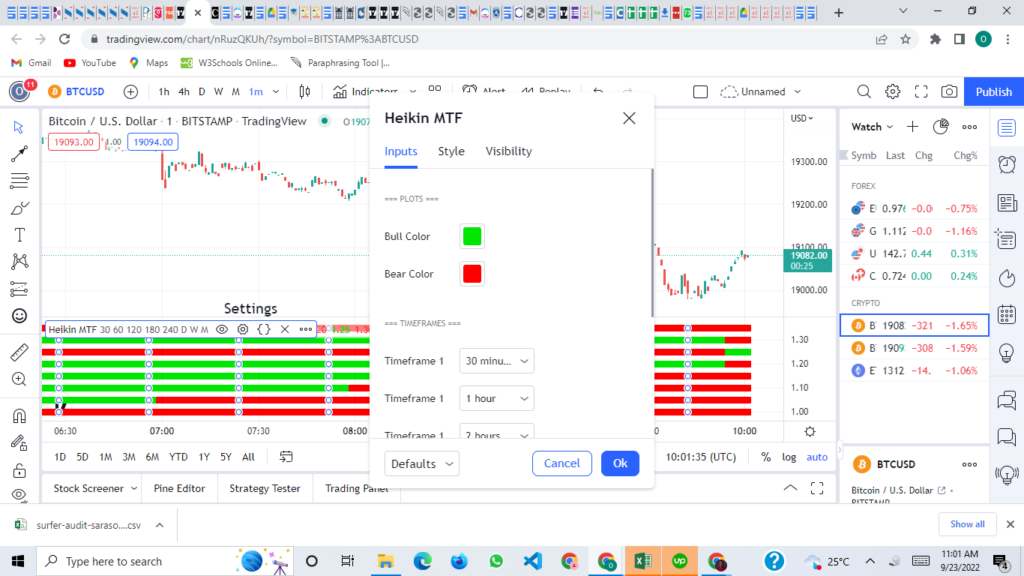
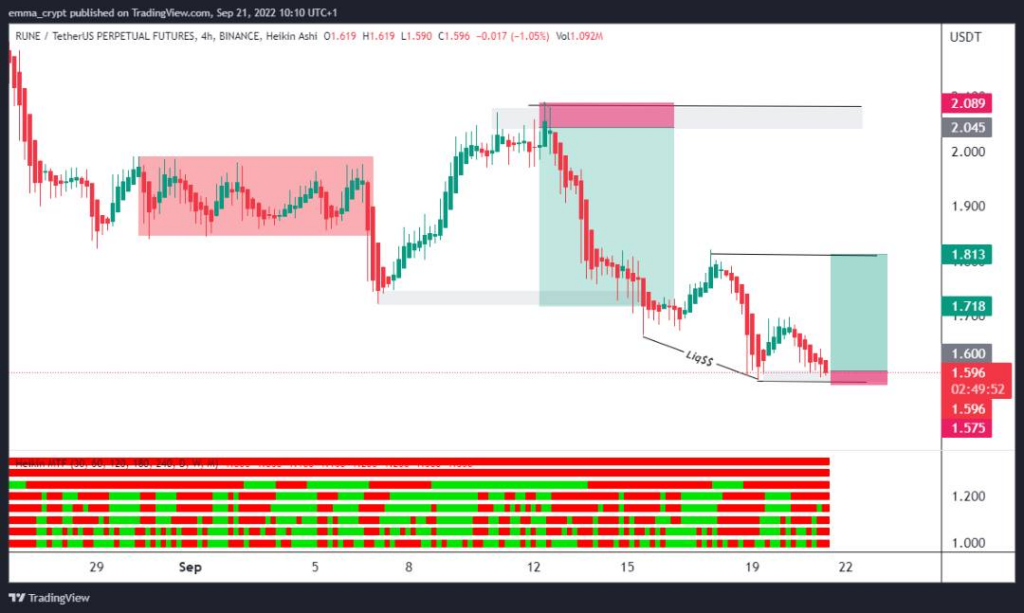
The opening and closing prices of Heikin Ashi candles are computed by this script across a wide variety of timeframes. If the candle that was generated during that interval is green, it will show up on the table as a green square; if red, it will show up on the table as a red square.
Because of this, you might want to use a Heikin Ashi chart to see if there is a difference in how the market moves. The green candles mean the market is on an uptrend, while red candles indicate a downtrend. You can use this strategy on multiple timeframes if you want to confirm a trend.
For example, you can use it on the one-hour chart and then check if there are any green candles on the four-hour chart. If there are, then it’s likely that an uptrend is happening. Conversely, if you see red candles in both the one-hour and four-hour timeframes, then it’s expected that a downtrend is occurring.
This strategy can also be used on other timeframes, such as daily or weekly charts. Remember that the longer the time frame, the more reliable it is.
Settings for a Heikin Multi-Time Frame Strategy
The Heikin Ashi candles are a popular tool among traders, and for a good reason. Not only do they provide a clear picture of the market trend, but they can also be customized to suit the needs of individual traders.
One of the most popular customization options is to change the colors of the Heikin Ashi candles. By doing so, traders can make the candles more visible on their charts and better identify market trends.
In addition, traders can also alter the timeframes on which the Heikin Ashi candles are calculated. This allows them to better match their trading strategy with the current market conditions. As a result, changing the colors and timeframes of the Heikin Ashi candles is a simple way to customize the charting tool to better suit your individual trading needs.
How to Use the Heikin Multi-Time Frame Strategy
First, you’ll need to set up your charting software to display Heikin Ashi candles. This is usually a pretty simple process, and there are plenty of tutorials online if you need help.
Once you’ve set your chart up, look at the trend on the longest time frame you’re comfortable trading. For this strategy, you’re looking for an uptrend on the daily chart.
Once you’ve found an uptrend that you want to trade, switch to a shorter time frame – like the 4-hour chart – and look for a pullback. The market will often retrace a portion of the previous day’s move before continuing higher, so this is where you’ll look for an entry point. Put simply; you’re buying when the market starts to move higher again after pulling back.
Once you’re in a trade, you’ll need to set a stop loss and take profit. A common approach is to place your stop loss below the most recent low on the 4-hour chart and take profit at 1.5 times your risk or better. That’s just one example, though – ultimately, it’s up to you to decide how much risk you’re comfortable with and where you want to take profits.
The Heikin Ashi multi-time frame strategy can help find trends and entries, but like any other approach, it’s not perfect. Backtesting and demo trading can help you get a feel for how this strategy works and whether it’s something that could work for you.
Heikin-Ashi Indicator Signals
Trend Strength
One of the most important things to do is to evaluate the trend for its strength. On the chart, minor corrections and consolidations can not be seen because the indicator has a smoothing effect.
It is best to apply trailing stop when trading using the Heikin-Ashi method in the direction of the trend if you want to maximize your profits. If the trend is strong, it is recommended that traders continue to profit from it as much as possible.
The following are the several types of Heikin-Ashi trends:
Bullish Trend
The occurrence of several green candlesticks in a row, without any red or black lower shadows indicates a bullish trend.
Bearish Trend
When the candlesticks are red and there are no higher wicks, this is a sign that the bears are in control.
Triangle
Triangles are one of the most reliable patterns in technical analysis. They occur often and can be found in all timeframes. The different types of triangles are symmetrical, ascending, and descending.
In the event that the signal breaks over the upper threshold of an ascending triangle or symmetrical, it is highly likely that the uptrend will continue. If candles continue to fall below the bottom line of the falling triangle, the downward trend will continue and likely become more pronounced.
Trend Reversal
A trend reversal is when the current trend starts to move in the opposite direction. For example, if the trend has been going up for a while, a trend reversal would be when it starts to go down.
Doji Candlestick
The Doji candlestick is one of the most important technical indicators for traders. It signals a potential trend reversal and can be used to enter or exit a trade. When the Heikin-Ashi signals a Doji candlestick, the current trend is about to reverse. This can be a precious signal for traders, as it can help them to enter or exit a trade before the trend reverses.
Wedges
A wedge is a type of chart pattern that is similar to a triangle. There are two types of wedges; rising and falling. A rising wedge indicator demands that a trader wait until the candlestick breaks below the bottom line of the indicator.
If you are looking at a falling wedge, you will want to watch for the candlestick to break above the top line of the indicator. Either way, these patterns can help show potential reversals in the market.
Benefits of the Heikin-Ashi Multi-Time Frame Strategy
The Heikin-Ashi multi-time frame strategy is a popular trading strategy that many traders use. There are many benefits to using this strategy. Let us discuss some of the most important ones.
One of the most important benefits of the Heikin-Ashi multi-time frame strategy is its ability to spot trends across multiple timeframes. This is because the Heikin-Ashi candlesticks are based on averages, which makes it easier to see when the price is moving in a particular direction.
Heikin Ashi candles frequently provide a smoother trend direction and aid in canceling out some noise or consolidations, which is another advantage of this approach.
Finally, the Heikin-Ashi multi-time frame strategy can also help you to manage your risk better. This is because you can use different time frames to filter out the noise and focus on the most important information.
Overall, the Heikin-Ashi multi-time frame strategy is an effective tool that any trader can use to improve their results. If you are not currently using this strategy, we recommend you start doing so as soon as possible.
Limitations of the Heikin-Ashi Multi-Time Frame Strategy
The Heikin-Ashi Multi Time Frame Strategy is a great tool for forex traders, but it does have some limitations. One of the biggest limitations is the time gap. This strategy only works if there is at least a four-hour time gap between the two frames.
If there is less than a four-hour time gap, the strategy will not work. Another limitation of the Heikin-Ashi Multi Time Frame Strategy is that it does not provide full-price information. This strategy only uses candlesticks, meaning you cannot see the full range of prices for each time frame.
Finally, this strategy can also be limited by the lack of price gaps. The Heikin-Ashi Multi Time Frame Strategy will not work if there are no price gaps. While these limitations can be frustrating, they should not deter you from using this strategy.
With a little practice, you can overcome these limitations and use the Heikin-Ashi Multi Time Frame Strategy to your advantage.
Trading on the Heikin-Ashi Multi-Time Frame Strategy
The Heikin-Ashi multi-time frame strategy is a great way to trade the markets. It’s a simple yet effective trade method that can help you make money in the long run.
The key to this strategy is to trade on the larger time frames, such as the 4-hour or daily chart, and to use the smaller time frames, such as the 1-minute or 5-minute chart, to find entries.
This can be difficult at first, but it’s not that hard once you get the hang of it. The Heikin-Ashi candles are a great way to identify trends and reversals, and using multiple time frames gives you an edge over other traders.
So, if you’re looking for a simple yet effective way to trade the markets, look no further than the Heikin-Ashi multi-time frame strategy.
FAQs
Is the Heikin-Ashi Multi-Time Frame Strategy Accurate?
The Heikin-Ashi multi-time frame strategy can predict future market movements with a high degree of accuracy. It’s backed up by extensive testing and real-world results. So if you’re looking for a reliable way to make money in the markets, it’s worth considering.
Which Timeframe Is Best For Heiken-Ashi?
There is no definitive answer to the question of which timeframe is best for Heiken-Ashi. However, many traders believe that longer timeframes offer more accurate signals, while shorter timeframes may be better for catching quick moves. Ultimately, it depends on the individual trader’s goals and preferences.
Some traders may even use multiple timeframes to get a more well-rounded view of the market. However, no matter which timeframe you choose, it’s important to remember that Heiken-Ashi is just one tool in your toolbox.
As with any technical indicator, it should not be used alone but in conjunction with other indicators and price action analysis.
Is Renko Better Than Heikin Ashi?
Renko and Heikin Ashi are two technical indicators technical traders can use to analyze price data. Renko creates a brick on the chart when the price moves a certain amount in a given direction, while Ashi smoothes prices.
While both indicators can be useful for identifying trends, Renko is better suited for longer-term analysis, while Heikin Ashi may be more useful for short-term analysis.
Conclusion
The Heikin Multi Time Frame indicator is a versatile tool that can be used in various ways to help you make better trading decisions. By understanding how it works and using it with other indicators, you can improve your chances of success in the markets.