What Is The RSI In Trading, And How To Trade On It?
RSI stands for Relative Strength Index and is a momentum oscillator that works on financial instruments. The indicator was first introduced by J.Welles Wilder back in 1978. The EA acts as an oscillator whose value ranges from 0 to 100.
Time Frame and the RSI
As RSI is a technical indicator, its oscillations can shift depending on the timeframe and the settings selected for the period. A 20-day RSI will employ the values based on the previous 20 candlesticks on the chart.
A 14-period RSI computes its calculations by taking the average of an asset’s most recent closing prices and dividing it by the mean of its 14-day high and 14-day low. The resulting number is then plotted on a scale of 0 to 100, with readings above 70 indicating that the asset is in an uptrend and readings below 30 indicating that it is in a downtrend.
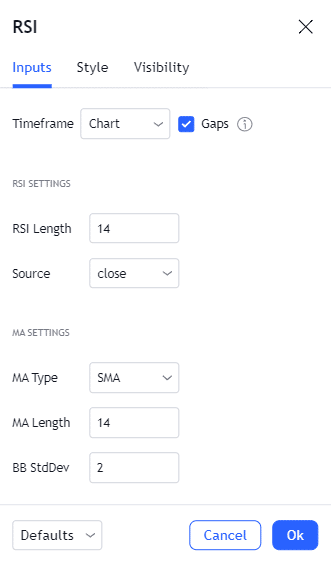
An RSI indicator may also include a moving average in the center. Fortunately, with the developments in the fintech sector, all the configurations are adjustable.
Image 1. The RSI period and its source value are configurable as per the choice of the trader. It can be computed by taking each candlestick’s open, high, lows, hlc 2, etc.
It is also possible to witness the value of a 15-minute RSI from the hourly chart depending on your charting platform. Multiple RSIs can be plotted to get more confirmations on your position.
The major pros and cons of the RSI can be summarized as follows:
Pros
Easy to understand by beginners
A good indicator for plotting divergences
Helps traders identify levels of reversals
Cons
It may provide many false signals
Possible Stages of the RSI
The RSI indicator can fluctuate between 0 and 100 as the price moves up and down. A high period value will make the curve flat as it takes the mean average takes more candles into account. Let us discuss how a casual trader can interpret the value of RSI:
Less than 20. A long-term bearish trend would cause the RSI to fall below the 20 point. This shows that the market is becoming oversold, and there can be a reversal anytime soon.
Greater than 80. A bullish trend will result in an increasing RSI value. A value over 80 means that the market is overbought.
Between 20 and 80. The price action between 20 to 50 is regarded as bearish, while that ranging from around 50-80 is bullish.
Remember that the 80 and 20 values are just for reference here. The criteria of overbought and sold conditions can change as per the liking of a trader.
How many days can it take for the market to reach the overbought and sold levels?
The movement of overbought and sold levels in the RSI depends on the period values. A low length will cause the indicator to abruptly move up and down with no significance. Generally, the 14-period Relative Strength Index is the favorite choice of most investors as it provides a suitable balance in movements.
RSI Divergences
Divergences is one of the common techniques used to determine the reversals. It occurs when the price is making new higher highs or lows while the RSI indicator is printing the opposite. There are two types of divergences that you should know as an investor:
The bullish divergence predicts that the price might be bound for a reversal after reaching a new low. The RSI indicator, in this case, would be moving upwards.
Used as an indicator for an upcoming reversal in the bullish trend. Here the RSI will be making lower highs and lows.
Moving averages and the RSI
RSI itself may contain a moving average, technically termed the MARSI indicator. Similar to the normal RSI, this can help you determine the current trend and get acceptable entry on your trades.
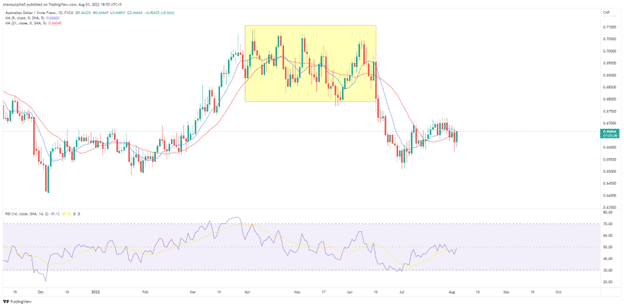
9 and 21-period moving averages are frequently used with the RSI to trade reversals or momentum positions. A bearish divergence coupled with a crossover of the 9 and 21 MAs can be a suitable option here. As moving average is a lagging indicator, you may have to wait some time before the two intersect each other to form a cross.
Image 2. The yellow part on the chart highlights frequent crossovers between the 9 and 21 period MAs. Meanwhile, the RSI has also reached an overbought condition signaling a reversal in the prior bullish trend.
RSI and the Fibonacci Intervals
RSI and Fibs are better suited for amateur or professional traders as it requires slightly complex calculations. The retracements observed from the Fibonacci can be coupled up with the momentum readings from the Relative Strength Index.
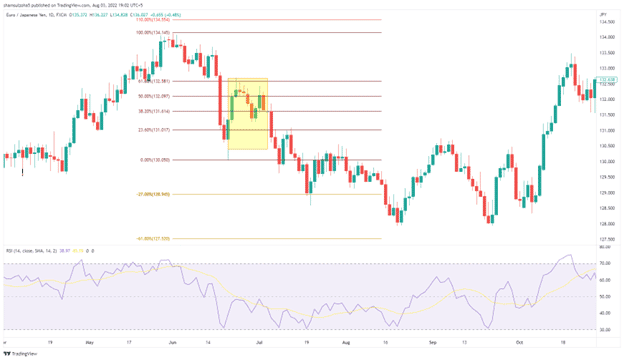
For example, the bearish pullback in a buy trend is calculated using the Fibs. The RSI indicates the reading between the 50 and 80 proving that the bulls are still in charge.
Image 3. Can you see that the RSI indicator does not cross the 50 mark as the price retraces to the 61.8% Fib level? The overall bias is still favorable for the short side.
RSI and the MACD
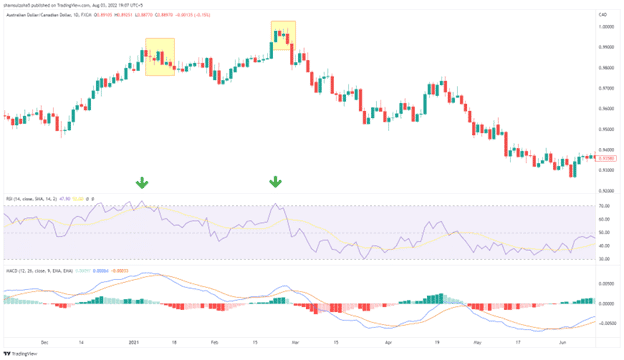
Both the RSI and MACD can be useful for determining the price momentum. The MACD can point out when the market is shifting over by printing respective green or red bars with a crossover. Confirm the signal with the help of the RSI indicator.
Image 4. The daily chart on AUDCAD shows that the price action is facing difficulties in moving further on the bullish side. The RSI and MACD indicator start printing a bearish outlook with the oversold condition and the red bars.
RSI and Bollinger Bands
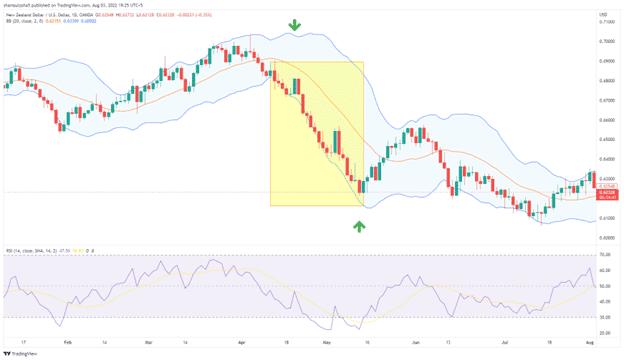
As the price enters the lower two lines in the Bollinger bands, take out the RSI indicator and look if it reaches an oversold point. Prepare yourself for a buy and execute the trade when needed. For a short trade, use the opposite approach.
Some traders can also use the same technique to sell further instead of buying. The important point to note is that the market should not enter below 20 for the RSI indicator and vice versa. The Bollinger band and the RSI strategy can be used with trading options.
Image 5. The two green arrows highlight bot scenarios that we have discussed above. The short trade is placed by noticing the momentum from the RSI indicator and the price entry in the lower channel of the Bollinger bands. When the RSI enters an oversold condition, you can close your initial entry and prepare for a buy trade. 6
RSI and the Candlestick Patterns
The candlestick patterns are the main trading tool in the arsenal of any price action trader. Each bar prints out a story which can easily be read with slight market knowledge. For our understanding, let us use the most common bullish and bearish engulfing patterns.
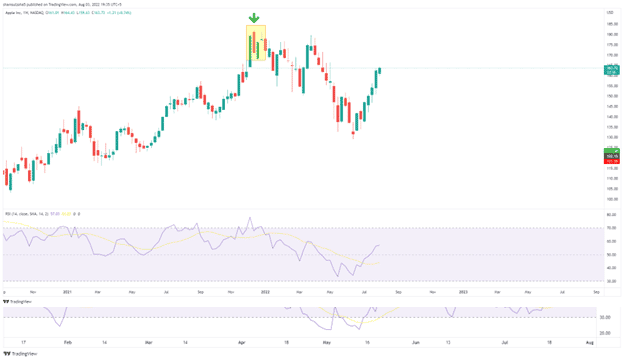
The strategy is simple, place a buy trade when the RSI is in an oversold area and a bullish engulfing pattern appears. The opposite criteria hold for a short position. You can also match candlesticks while the price fluctuates between 20 and 80 to trade with the current momentum.
Image 6. The weekly chart on the apple shows a bearish engulfing pattern accompanied by an overbought signal from the RSI indicator. Can you predict the next move? Hint: It is indicated by the green arrow on the chart.6
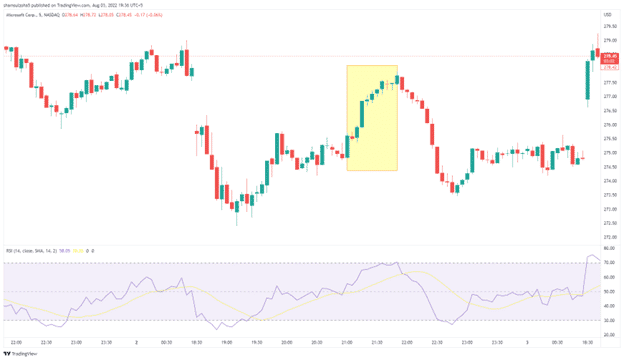
Image 7. An RSI value of above 50 follows the bullish bars on the MSFT 5-minute chart. A red bar should give you a proper point for the exit. The stop loss can be placed beneath the first green bar.
Fundamentals and RSI
The RSI indicator can provide a good indication of the growth and depreciation of a company. A good observation was made from the 233kly chart on apple in image 7 where the RSI indicated an overbought scenario. Soon after, the stock fell or faced a slight pullback. The incoming numbers from the big companies can provide a confluence when matched with the Relative Strength Index. It would be better if you could use several other indicators before making a final buy or sell decision.
Using RSI on Multiple Instruments
It won’t be wrong to say that RSI is a universal indicator that can work on most instruments. The winning rate would undoubtedly differ from one-time frame and asset to another. Backtesting the indicator by developing your custom algorithm can help you see the expected profit factor, winning rate, etc.
Managing Risk while Trading RSI
Without proper risk management, you will certainly receive a margin call on your account sooner or later. While RSI provides a reasonable winning rate in good market conditions, it has its limitations and will not work 100% of the time. It is also important to have a sound mindset as it constitutes 80% of the total regime.
Multi Time Frame Analysis with the RSI
Multi-time frame analysis is essential for getting additional confirmations and understanding the overall market structure. It is a common technique used by price action traders. They use the Relative Strength Index alongside the support/resistance lines, key levels, supply/demand zones, Fibs, and trend lines.
As a day trader, you would like to start off with the daily chart. Take out your RSI tool and find a good opportunity. Once confirmed, dive down to the H1 time frame and then to the 5 minutes to get a suitable entry. Using this technique will ensure that you enter the market at the exact point and avoid the risk of facing a drawdown.
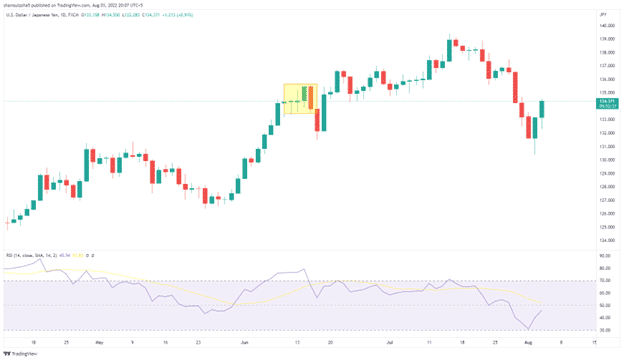
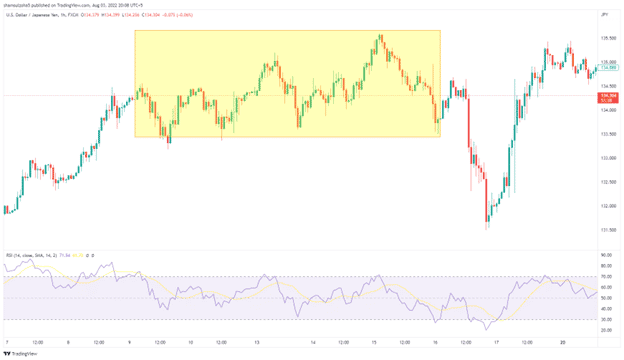
Image 9. Using the daily chart on USDJPY, we found an area where the RSI is hanging above the 70 mark. The market is clearly oversold at this point. To find a trade entry, we dive down to the lower time frame, such as the H1.
Image 9. The same area on the H1 chart shows that the RSI is frequently peaking. There is a slight resistance at the 133 mark. We can scalp the markets with a short trade as soon as the point breaks. The stop loss can lie at the previous point of conflict around 134, while the take profit is the next oversold condition.
Some Important FAQs
What is the winning rate of the RSI indicator?
The winning rate of any indicator can differ considerably depending on the strategy and the risk management. It is quite easy to win trades with a poor risk-reward ratio of 4:1.
Can scalpers use the RSI indicator?
RSI indicators can be used by scalpers, day and swing traders alike. Scalpers will have to use the system on the lower time frames so that it shows the movements accordingly.
Is the RSI indicator suitable for beginners?
Beginners and professionals can use the RSI indicator. Before starting with the indicator, use it on a demo account to check its structure.
Summary
RSI indicator can be a useful tool for the general trading community, provided proper risk techniques and mindset are followed. It is a multi-purpose technical indicator that provides insights into the momentum, reversals, and divergences. The outcome of your trades will depend on how good you are as a trader. Fortunately, many brokers provide a demo account that can be used to test your strategies before proceeding onto a live portfolio.