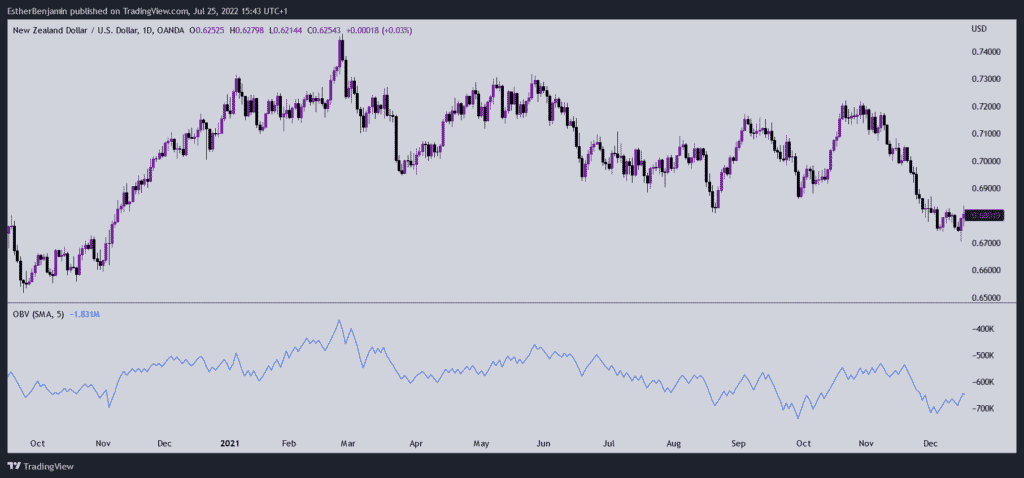
What is the On-Balance-Volume (OBV) Indicator?
The OBV indicator was developed by Joe Granville in his 1963 book Granville’s New Key to Stock Market Profits. The idea behind the indicator is that volume precedes price. In other words, changes in volume can be used to predict price changes.
The OBV indicator is calculated by taking the difference between the total volume of all up days and the total volume of all down days. This difference is then added to a running total. So, if the OBV indicator is rising, it means that there have been more up days than down days, and vice versa.
Uses of the OBV Indicator
There are a few different ways that the OBV indicator can be used. First, it can be used to confirm price movements. For example, if the OBV is rising while the price is rising, it is a sign that the price move is being driven by strong buying pressure.
Second, the OBV can be used to identify divergences. A divergence occurs when the OBV and price are moving in opposite directions. For example, if the price is making new highs but the OBV is not, it could be a sign that the rally is losing steam and may soon reverse.
Finally, the OBV can be used to generate buy and sell signals. A common signal is known as an “OBV breakout.” This occurs when the OBV breaks out from a recent trading range. It can be used as a buy signal if the OBV breaks out above its recent highs, or as a sell signal if the OBV breaks out below its recent lows.
What Does On-Balance Volume Tell You?
The OBV indicator can be used to confirm price movements, identify divergences, and generate buy and sell signals. The on-balance volume provides a running total of an asset’s trading volume and can be used to predict changes in price. For example, if the OBV is rising while the price is rising, it means that the price move is being driven by strong buying pressure. Besides this, here are 3 things you should know about the OBV indicator.
1. On-balance volume is a momentum indicator
The OBV indicator is a momentum indicator, which means it measures the speed and direction of price movements. Price movements that are accompanied by strong volume tend to be more significant than those that are not. This is because they are more likely to be sustained.
2. On-balance volume can be used to confirm trends
The OBV indicator can be used to confirm trends. For example, if the price is in an uptrend and the OBV is rising, it confirms that the trend is bullish. Similarly, if the price is in a downtrend and the OBV is falling, it confirms that the trend is bearish.
3. On-balance volume can be used to predict reversals
The OBV indicator can also be used to predict reversals. For example, if the price is in an uptrend and the OBV starts to fall, it could be a sign that the trend is about to reverse. Similarly, if the price is in a downtrend and the OBV starts to rise, it could be a sign that the trend is about to reverse.
Interpretation of the OBV Indicator
The interpretation of the OBV indicator is relatively straightforward. If the OBV is rising, it means that there have been more up days than down days, and vice versa. TheOBV can be used to confirm price movements, identify divergences, and generate buy and sell signals.
The Difference Between OBV and Accumulation/Distribution
The OBV indicator is similar to the accumulation/distribution (A/D) indicator. Both indicators measure the flow of money into and out of a security. The main difference between the two is that the A/D indicator uses price changes instead of volume.
The formula for the A/D uses the position of the close relative to the high and low of the day. If the close is above the high, it is assigned a value of 1. If the close is below the low, it is assigned a value of -1. If the close is equal to the high or low, it is assigned a value of 0.
The OBV indicator, on the other hand, simply uses volume. So, if the price is up on the day, all of the volume for that day is added to a running total. If the price is down on the day, all of the volume for that day is subtracted from the running total.
Limitations of OBV
Like any indicator, OBV has its limitations;
The indicator is lagging
The OBV indicator is a lagging indicator, which means it only tells you what has happened in the past. This can be a problem because by the time the OBV signals a reversal, the price may have already moved significantly.
The indicator is subject to interpretation
The interpretation of the OBV indicator is subjective and open to debate. What one trader might interpret as a bullish signal, another trader might interpret as a bearish signal.
The indicator is not always accurate
The OBV indicator is not always accurate. For example, it might give false signals in choppy markets or during periods of low volume.
Tips for trading with the OBV Indicator
Look for divergences
One way to trade with the OBV indicator is to look for divergences. A divergence occurs when the price and the OBV indicators move in opposite directions. For example, if the price is making new highs but the OBV is not, it could be a sign that the trend is about to reverse. This can be a bullish or bearish signal, depending on the direction of the price.
Use with other indicators
The OBV indicator is best used in conjunction with other indicators. For example, you could use it with support and resistance levels, Fibonacci levels, or moving averages.
Don’t rely on it too much
The OBV indicator is a useful tool, but it should not be relied on too heavily. This is because it is lagging and subject to interpretation. So, always use it in conjunction with other indicators and confirm signals with price action.
How to calculate OBV
There are a few different ways to calculate the OBV indicator. One way is to simply add up all of the volumes for each day and plot it on a chart. Another way is to take a moving average of the volume. The most common method is to use a 10-day moving average.
To calculate the OBV, you will need two things:
1. A running total of volume
2. The closing price for each day
If the closing price is higher than the previous day’s close, you will add the volume for that day to the running total. If the closing price is lower than the previous day’s close, you will subtract the volume for that day from the running total. If the closing price is the same as the previous day’s close, you will not make any changes to the running total.
For example, let’s say that on Monday, the stock price closes at $10 and the volume is 100 shares. The OBV would be 100 (the volume for that day). On Tuesday, the stock price closes at $11 and the volume is 200 shares. The OBV would be 300 (the volume for that day plus the OBV from Monday). On Wednesday, the stock price closes at $9 and the volume is 300 shares. The OBV would be 0 (the volume for that day minus the OBV from Monday and Tuesday).
The OBV can be plotted on a chart to help you identify trends and reversals. The indicator is usually plotted as a line, but it can also be plotted as a histogram.
While calculating OBV, here are 3 rules to note;
- If today’s closing price is higher than yesterday’s close, then: Current OBV = Previous OBV + Today’s Volume
- If today’s closing price is lower than yesterday’s close, then: Current OBV = Previous OBV – Today’s Volume
- If today’s closing price is equal to yesterday’s close, then: CurrentOBV = Previous OBV (no change)
However, you won’t have to calculate this by yourself as most trading platforms have this indicator as a default.
How to Combine the OBV With Other Strategies
To combine the OBV indicator with other strategies, you will need to use technical analysis. Technical analysis is a way of predicting the future price of a security based on past price data. Many different technical indicators can be used, but some of the most popular ones include moving averages, support and resistance levels, and Fibonacci levels.
When using technical analysis, it is important to remember that no one indicator is perfect. This is why it is important to use multiple indicators to confirm signals. For example, if you see a bullish divergence on the OBV indicator, you could look for confirmation with a moving average or a support and resistance level.
The OBV can be combined with other strategies to help you make better-informed trading decisions. However, it is important to remember that no indicator is perfect. So, always use the OBV in conjunction with other indicators and confirm signals with price action.
5 Steps to Trading With the On-Balance Volume Indicator
Now that you know what the On-Balance Volume indicator is and how to read it, let’s take a look at how to use it in trading.
There are a few things to keep in mind when using the OBV. First, although this indicator can be used on any timeframe, it’s generally more accurate on longer timeframes. Second, the OBV doesn’t always move in tandem with price. Sometimes price may be making new highs while the OBV is lagging behind, or vice versa. This divergence can be used as a possible early warning sign of a trend change.
With that said, here are five steps to trading with the On-Balance Volume indicator:
1. Find market trends with the OBV
The first step is to find market trends using the OBV. As we mentioned earlier, the OBV is a leading indicator, so it can be used to identify both uptrends and downtrends.
In an uptrend, the OBV will generally make higher highs and higher lows. And in a downtrend, the OBV will make lower highs and lower lows.
2. Enter trades with the OBV
Once you’ve identified a market trend using the OBV, the next step is to enter trades in the direction of that trend.
For example, if you’re looking at a daily chart and you see that the OBV is making higher highs and higher lows, you would enter long trades when the OBV makes a new high.
Conversely, if you’re looking at a daily chart and you see that the OBV is making lower highs and lower lows, you would enter short trades when the OBV makes a new low.
3. Place stop-loss orders below key support or resistance levels
When trading with the OBV, it’s important to place your stop-loss orders below key support or resistance levels. This will help protect your profits in case the market reverses against you.
For example, if you’re long on a stock and the OBV breaks below a previous low, that could be a sign that the uptrend is over and it’s time to exit the trade.
4. Take profits at key resistance or support levels
Just as you would place your stop-loss orders below key support or resistance levels, you would also take profits at key resistance or support levels.
For example, if you’re long on a stock and the OBV breaks above a previous high, that could be a sign that the uptrend is continuing and it’s time to take profits
5. Use trailing stop-loss orders to protect your profits
Another way to protect your profits is to use trailing stop-loss orders. With this type of order, your stop loss will automatically move up as the stock price moves in your favor.
For example, let’s say you’re long on a stock and the price moves up 10%. You could place a trailing stop-loss order at 8% so that if the price falls back to that level, your trade will be automatically closed.
Trailing stop-loss orders are a great way to protect your profits and lock in gains as a trade moves in your favor.
In conclusion, the On-Balance-Volume (OBV) Indicator is a technical indicator that uses volume data to predict future price movements. The OBV is lagging and subject to interpretation, so it should not be relied on too heavily. Instead, it should be used in conjunction with other indicators and confirm signals with price action.