What is the Flag Pattern Trading in Forex?
The flag pattern is a continuation pattern that forms when the market makes a sharp move in one direction followed by a period of consolidation. This consolidation period typically forms a flag or pennant chart pattern. The flag pattern is considered a bullish or bearish continuation pattern and can be found in both uptrends and downtrends.
How to identify a Flag Pattern in Forex Trading?
There are a few things that you will want to look for when trying to identify the flag pattern. First, you will want to look for a sharp move in the market followed by a period of consolidation. This consolidation period should form a flag or pennant chart pattern. Second, you will want to make sure that the market is in an overall trend before considering entering into a trade with this pattern. Finally, you will want to wait for a breakout from the consolidation period before entering into a trade. The flag pole is the sharp move in the market and the flag is the consolidation period.
Types of Flag Patterns
There are two types of flag patterns, bullish and bearish.
Bullish Flag Patterns

Bullish flag patterns form when the market makes a sharp move higher followed by a period of consolidation. This is a continuation pattern and is typically found in an uptrend. You can enter into a long trade when the market breaks out above the consolidation period. Your stop loss should be placed below the consolidation period.
Bearish Flag Patterns
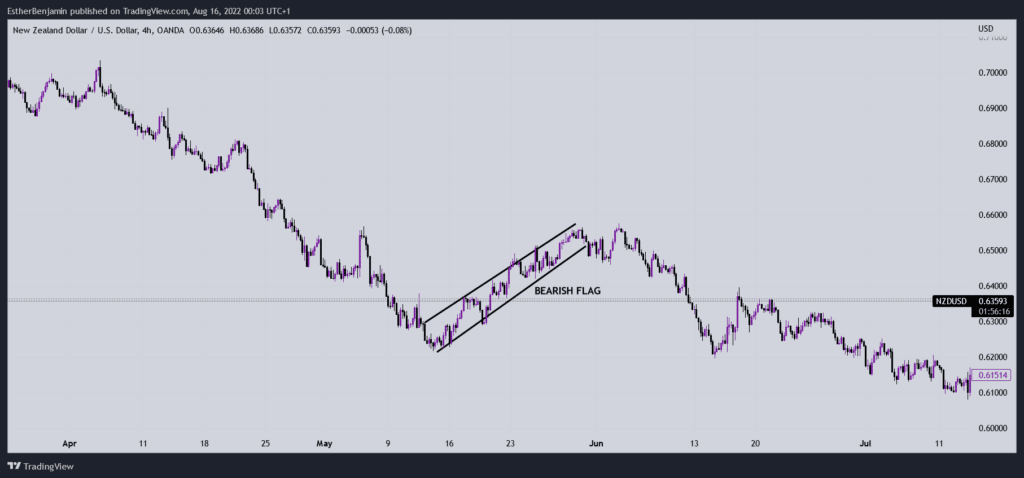
Bearish flag patterns form when the market makes a sharp move lower followed by a period of consolidation. This is a continuation pattern and is typically found in a downtrend. You can enter into a short trade when the market breaks out below the consolidation period. Your stop loss should be placed above the consolidation period.
What are the benefits of trading with the Flag Pattern?
Now that you know what the flag pattern is and how to identify it, let’s discuss some of the benefits of trading with this pattern.
1 Identifying Trading Opportunities
Flag patterns can be used as trading signals because they can help traders determine the market’s likely direction. If the market is in an uptrend, traders can look for bullish flag patterns as signals to enter into long trades. If the market is in a downtrend, traders can look for bearish flag patterns as signals to enter into short trades.
2 Setting Stops and Limits
Flag patterns also help traders set stops and limits because the consolidation period typically forms a well-defined pattern. This gives traders a clear level at which to place their stop loss orders. But, the exact stop placement strategy will vary depending on the trader’s risk tolerance and goals.
3 Managing Risk
Another benefit of trading with flag patterns is that they can help traders manage risk. This is because flag patterns often form after a sharp move in the market. So, by entering into a trade after the market has already made a significant move, traders can manage their risk by giving the market room to move in their favor.
How to trade the Flag Pattern in Forex Trading?
Now that you know what the flag pattern is and some of the benefits of trading with it, let’s discuss how you can trade this pattern.
1 Wait for a breakout from the consolidation period
Once you identify a flag pattern, you will want to wait for the market to break out from the consolidation period before entering into a trade. This breakout can be to the upside or downside depending on the direction of the overall trend.
2 Enter your trade in the direction of the breakout
Once the market breaks out from the consolidation period, you can enter into a trade in the direction of the breakout. If the market breaks out to the upside, you would enter into a long trade. If the market breaks out to the downside, you would enter into a short trade.
3 Place your stop loss
A stop loss should be placed below the consolidation period for a long trade and above the consolidation period for a short trade.
4 Set your profit target
Your profit target will depend on your risk tolerance and goals. Some traders may choose to set their profit target at the next area of resistance or support. Others may choose to take profits once the market has moved a certain percentage in their favor.
5 Manage your trade
Once you are in a trade, it is important to manage it properly. This means monitoring the market for any changes that could affect your trade. You will also want to make sure you stick to your profit target and stop loss levels.
Other Chart Patterns In Trading
Here are 5 other chart patterns that you should be aware of as a trader:
1 The Triangle Pattern
The triangle pattern is a continuation pattern that can be either bullish or bearish. This pattern is formed when the market consolidates and forms lower highs and higher lows. A breakout from this pattern can signal a move in the direction of the overall trend.
2 The Head and Shoulders Pattern
The head and shoulders pattern is a reversal pattern that is typically found at the top of an uptrend. This pattern is formed when the market forms two higher highs followed by a lower high. A break below the neckline of this pattern can signal a move to the downside.
3 The Inverse Head and Shoulders Pattern
The inverse head and shoulders pattern is the opposite of the head and shoulders pattern. This pattern is found at the bottom of a downtrend and is formed when the market forms two lower lows followed by a higher low. A break above the neckline of this pattern can signal a move to the upside.
4 The Wedge Pattern
The wedge pattern is a continuation or reversal pattern that can be either bullish or bearish. This pattern is formed when the market consolidates and forms either higher highs and higher lows (bullish wedge) or lower highs and lower lows (bearish wedge). A breakout from this pattern can signal a move in the direction of the overall trend.
5 The Rectangle Pattern
The rectangle pattern is a continuation pattern that is typically found in a market that is consolidating after a sharp move. This pattern is formed when the market forms a horizontal support and resistance level. A breakout from this pattern can signal a move in the direction of the overall trend.
These are just some of the chart patterns that you should be aware of as a trader. There are many other patterns out there, so it’s important to do your own research and find what works best for you.
5 Factors to Consider Before Using Flag Patterns
Before using any trading strategy, it’s important to consider some key factors. Here are 5 factors to consider before using flag patterns:
1 The Direction of the Overall Trend
When considering any trading strategy, it’s important to look at the overall trend. This will help you determine if a strategy is likely to be successful. If the overall trend is bullish, then you would look for flag patterns that form in an uptrend. If the overall trend is bearish, then you would look for flag patterns that form in a downtrend. Generally, it’s advisable to trade with the overall trend.
2 The Size of the Consolidation Period
The size of the consolidation period is another important factor to consider. A larger consolidation period is generally more significant than a smaller one. This is because it takes more time for market participants to form a consensus. A longer consolidation period is also more likely to see a breakout in the direction of the overall trend.
3 The Volume During the Breakout
Volume is an important indicator that can help you confirm a breakout. Generally, you want to see volume increase during the breakout. This is because it shows that more market participants are participating in the move.
4 The Location of the Pattern
The location of the pattern is also important to consider. A flag pattern that forms near a major support or resistance level is more significant than one that forms in the middle of a trend. This is because a breakout from these levels could signal a change in the direction of the overall trend.
5 The Timeframe
The timeframe that you trade on will also affect your results. Generally, shorter timeframes are more volatile and therefore riskier. Longer time frames tend to be more stable and therefore provide more reliable signals.
Flag patterns can be a useful tool for traders, but it’s important to consider these factors before using them.
How To Combine Flag Patterns With Indicators
Flag patterns can be used with a variety of indicators to help confirm a breakout. Some popular indicators that you could use include:
1 Moving Averages
One popular way to trade flag patterns is with moving averages. Generally, you want to see the price action break above or below the moving average before taking a position. This can help confirm that the breakout is likely to continue. The idea is that if the price is above the moving average, then it’s in an uptrend. If the price is below the moving average, then it’s in a downtrend. So if the flag pattern forms in an uptrend and breaks above the moving average, then it’s a bullish signal. If the flag pattern forms in a downtrend and breaks below the moving average, then it’s a bearish signal.
2 Fibonacci Retracements
Another popular way to trade flag patterns is with Fibonacci retracements. These are horizontal lines that are placed at key levels of support and resistance. The idea is that if the price action breaks above or below these levels, then it’s likely to continue in that direction. So if the flag pattern forms in an uptrend and finds resistance at a key Fibonacci level, then it’s a bullish signal. If the flag pattern forms in a downtrend and breaks below a key fibonacci level, then it’s a bearish signal.
3 Trendlines
Trendlines are another way to trade flag patterns. The idea is that if the price action breaks above or below a trendline, then it’s likely to continue in that direction. So if the flag pattern forms in an uptrend and the price action breaks above the trendline, then it’s a bullish signal. If the flag pattern forms in a downtrend and the price action breaks below the trendline, then it’s a bearish signal.
4 Candlestick Reversals
Candlestick reversals can also be used to trade flag patterns. The idea is that if a candlestick formation forms at the end of a flag pattern, then it’s a signal that the breakout is likely to continue. So if you see a bullish candlestick formation at the end of a flag pattern in an uptrend, then it’s a signal that the breakout is likely to continue. If you see a bearish candlestick formation at the end of a flag pattern in a downtrend, then it’s a signal that the breakout is likely to continue.
FAQs About Flag Patterns
1 What is the flag pattern?
The flag pattern is a chart formation that can be used to determine the direction of breakouts while trading. They can be found in both uptrends and downtrends, and are generally considered a continuation signal.
2 How do I identify a flag pattern?
There are a few things to look for when trying to identify a flag pattern. First, you want to see a sharp move in price followed by a period of consolidation. This consolidation should be relatively short-lived compared to the initial move. Second, you want to see the price action form what looks like a “flag” or “pennant” formation during this consolidation period. Third, you want to see the price action break out of this consolidation period in the same direction as the initial move. Ultimately, flag patterns are reliable tools used by many traders around the world. While using them, make sure you look out for confluence and manage your risk to ensure you get the best possible results.
Read more: