What are Chart Patterns?
Chart patterns are simply shapes that emerge on price charts as a result of the movement of price over time. These patterns can be used to make predictions about where the price is likely to go in the future. While there is no guarantee that these predictions will always be accurate, technical traders believe that chart patterns can give them an edge in the market.
There are two main reasons why technical traders use chart patterns. Firstly, they can be used to identify potential turning points in the market. This means that if a trader sees a chart pattern emerging, they may exit their position before the price starts to move in the opposite direction. Secondly, chart patterns can be used to identify potential trading opportunities. This means that if a trader sees a chart pattern emerging, they may enter a position in the market in anticipation of the price moving in the predicted direction.
What are Wolfe Waves?
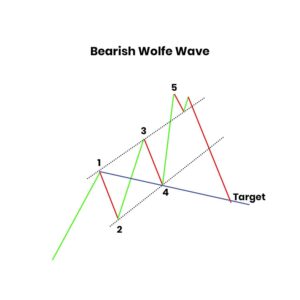
Wolfe Waves are chart patterns that are believed to indicate potential turning points in the market. These patterns are named after Bill Wolfe, who first described them in his book “Practical Pattern Recognition for Trend Following Stocks”. Wolfe Waves occur when the price action creates a specific shape on the chart. This shape is created by five waves, which are labeled as follows:
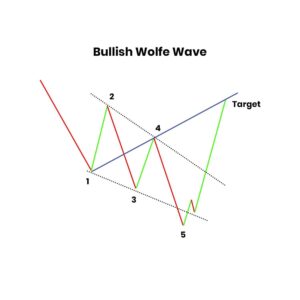
– Wave 1: The first wave is a small up-move followed by a small down-move.
– Wave 2: The second wave is a small down-move followed by a small up-move.
– Wave 3: The third wave is a large up-move that goes above the high of Wave 1
– Wave 4: The fourth wave is a small down-move that retraces some of the gains from Wave 3.
-Wave 5: The final wave that leads to a breakout.
The key thing to remember about Wolfe Waves is that they are created by specific price action. This means that they can be difficult to identify, especially in real-time. However, once you know what to look for, Wolfe Waves can be easy to spot on a price chart.
Wolfe Waves and Price Channels
One major challenge with trading price channels is that they are often broken. This means that a trader may enter a position only to see the price move in the opposite direction, resulting in a loss. Wolfe Waves offer a way to trade price channels with reduced risk.
The reason for this is that Wolfe Waves always occur within a price channel. This means that if the price breaks out of the Wolfe Wave pattern, it is likely to continue moving in the same direction as the breakout. This makes it easier for traders to predict the future direction of the market and take positions accordingly. For example, if the price breaks out of a Wolfe Wave pattern to the upside, a trader may enter a long position in anticipation of the price continuing to move higher.
How to Identify Wolfe Waves
There are four steps that you need to follow in order to identify Wolfe Waves on a price chart. These steps are as follows:
1. Look for a market with a clear trend.
Wolfe Waves only occur in markets that are trending. This means that you should look for an up-trend or down-trend on the price chart before trying to identify Wolfe Waves. This will make it easier to spot the pattern.
2. Look for two Symmetrical waves
When a Wolfe wave forms s, waves 1-2 should be equal or approximately equal to waves 3-4. This means that you should look for two waves that are of a similar size and shape.
3. Wave 3-4 Should Stay In the Channel Created by Wave 1-2
Waves 3-4 should stay within the channel created by waves 1-2. This is one of the key things to look for when trying to identify Wolfe Waves.
4. Waves 3 and 5 are often 127% or 162% Fibonacci extensions
Make sure waves 3 and 5 are Fibonacci extensions of the previous channel point.
5. Wave 5 Should Breakout of the Channel
The final wave in the pattern, wave 5, should break out of the channel created by waves 1-2. This is a key signal that a Wolfe Wave has formed and that the price is likely to continue moving in the direction of the breakout.
Why Do We Use Wolfe Waves?
Wolfe Waves offer several potential benefits for traders. Firstly, as we have seen, they can be used to trade price channels with reduced risk. This provides a way to take advantage of clear trends while limiting the downside risk.
Secondly, Wolfe Waves can be used as an entry signal for trend-following strategies. As we have seen, the breakout of wave 5 is a key signal that the price is likely to continue moving in the direction of the breakout. This makes it an ideal entry point for trend-following strategies.
Finally, Wolfe Waves can also be used to identify potential turning points in the market. This is because they often occur at key levels of support and resistance. For example, if the price is trending higher and forms a Wolfe Wave pattern at a level of previous resistance, this may be a sign that the market is about to turn and begin moving lower. Similarly, if the price is trending lower and forms a Wolfe Wave pattern at a level of previous support, this may be a sign that the market is about to turn and begin moving higher.What is The Gartley?
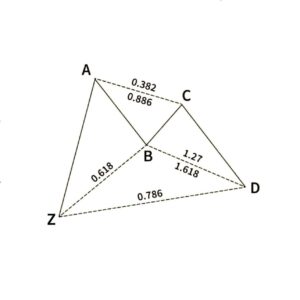
The Gartley is a chart pattern that is used to identify potential reversals in the market. The pattern is named after H.M. Gartley, who first described it in his book “Profits in the Stock Market”. The Gartley is a complex pattern that can be difficult to spot, but it can be a very useful tool for traders. A Gartley consists of a huge impulse move followed by two smaller pullback waves.
From the image here, ZA shows the first impulse and AB is a 61.8% Fibonacci retracement of minus Z. This is shown by segment ZB.
Then we observe a smaller impulse opposite to that of A at point B. Then at point C, the price makes a reversal impulse that is opposite to that of point B.
Most importantly, the best point of entry for selling or buying is point D. This is because it usually acts as a 127.2% or 161.8% fibonacci extension of the XA move. Also, point D also aligns with the 78.6% Fibonacci retracement of wave ZC.
Why Do We Use Gartleys?
The Gartley pattern is a useful tool for traders because it can be used to identify potential reversals in the market. This is because the pattern often occurs at key levels of support and resistance. The aim of using the Gartley pattern is to enter the market at point D, which is usually a good level for taking profit.
The Gartley pattern can also be used as an entry signal for trend-following strategies. This is because the breakout of point D is often a key signal that the price is likely to continue moving in the direction of the breakout.
5 Factors to Consider Before Using Wolf waves and gartleys
Now that we have covered the basics of Wolfe Waves and Gartleys, let’s take a look at some of the key factors that you need to consider before using them.
1. The Time Frame
The first factor to consider is the time frame that you are trading on. Wolfe Waves and Gartleys can occur on any time frame so the time frame that you use will depend on your trading style. For example, if you are a day trader you may want to use a shorter time frame such as 5 minutes or 15 minutes. If you are a swing trader you may want to use a longer time frame such as 1 hour or 4 hours.
2. The Nature of the Financial Market
The second factor to consider is the market that you are trading. Wolfe Waves and Gartleys can occur in any market so it is important to make sure that you understand the market that you are trading. For example, if you are trading forex you need to be aware of the different currency pairs and how they move. If you are trading stocks you need to be aware of the different sectors of the stock market and how they move.
3. The Indicators
The third factor to consider is the indicators that you are using. Wolfe Waves and Gartleys can be used with a variety of different indicators but it is important to make sure that you understand how they work. For example, if you are using moving averages you need to know how to interpret them. If you are using Fibonacci levels you need to know how to use them.
4. The Strategy
The fourth factor to consider is the strategy that you are using. Wolfe Waves and Gartleys can be used with a variety of different strategies but it is important to make sure that you understand how they work. For example, if you are using a trend-following strategy you need to know how to identify the trends. If you are using a reversal strategy you need to know how to identify the reversals.
5. The Risk
The next factor to consider is the risk that you are taking. Wolfe Waves and Gartleys can be used with a variety of different risk management strategies but it is important to make sure that you understand how they work. For example, if you are using stop losses you need to know where to place them. If you are using take profit levels you need to know where to place them.
6 The Market Trend
The last factor to consider is the market trend. Wolfe Waves and Gartleys can be used in both trending markets and range-bound markets but it is important to make sure that you understand how they work. For example, if you are trading in a trending market you need to know how to identify the trend. If you are trading in a range-bound market you need to know how to identify the support and resistance levels.
Other Chart Patterns Used In Trading
So far, we have covered two of the most popular chart patterns that traders use, which are Wolfe Waves and Gartleys. However, there are other chart patterns that can be used in trading.
1. Head and Shoulders
The head and shoulders pattern is a reversal pattern that can be used to trade both bullish and bearish reversals. The pattern is created by three highs, with the second high being the highest point (the head), and the two outside highs being the shoulders. The neckline is created by drawing a line through the lows of the left shoulder and head, and the right shoulder. A break of the neckline is considered to be a signal to enter the market.
2. Double Top/Bottom
The double top/bottom pattern is a reversal pattern that can be used to trade both bullish and bearish reversals. The pattern is created by two highs (double top) or two lows (double bottom) that are roughly equal. The neckline is created by drawing a line through the lows of the double bottom, or the highs of the double top. A break of the neckline is considered to be a signal to enter the market.
3. Triple Top/Bottom
The triple top/bottom pattern is a reversal pattern that can be used to trade both bullish and bearish reversals. The pattern is created by three highs (triple top) or three lows (triple bottom) that are roughly equal. The neckline is created by drawing a line through the lows of the triple bottom, or the highs of the triple top. A break of the neckline is considered to be a signal to enter the market.
Ultimately, Wolfe Waves and The Gartley pattern can help you improve your trading strategy. Make sure you understand them before using them and as always, manage your risk.
Read more: