It’s no secret the crypto market has been on the bear side for the past six months or so, where it has lost over $2 trillion in market cap. Most individuals invested in the space have seen their portfolios suffer significantly, and even most businesses have had to lay off staff to get by.
Everyone within the space can’t wait for the crypto winter to end. And this is why the Pi cycle indicator flashing a bottom for BTC is significant, as it shows after months of suffering, the market could be on the way to recovery.
The importance of the indicator is amplified by the fact that it has accurately predicted past bottoms and tops, which has built its reputation as reliable. And this helps explain the recent interest in the indicator. Let’s explore how the Pi cycle indicator works, its flaws, and how to best use it in your trading/investing analysis.
How The Pi Cycle Indicator Works
The Pi cycle top/bottom indicator is made up of 3 moving averages which, when divided by each other, are equal to the value of π. For the top indicator, the formula for Pi is long moving average divided by short moving average (π=Long MA/Short MA). That works out to 350/111 = 3.153, roughly the value of Pi.
According to the developers of the indicator, initially, they realigned the existing “Pi moving average” pair (350/111) to see if it could cross at the bottom of the Bitcoin price, which didn’t happen. It became a lagging indicator for both 2015 and 2018 cycle bottoms. However, a possible pair was discovered when the short MA was set to 150, leading to the following formula:
Π = Long MA / 150
Long MA = π*150
Long MA = 471 (rounded to the nearest whole number)
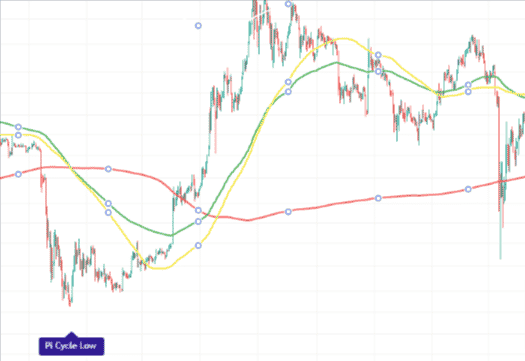
It was then the Pi MA pair of 471/150 was born. They add that using the multiple x0.745 of the 471-day SMA and the 150-day EMA (exponential moving average to account for short-term volatility), the price of Bitcoin bottoms at where the two moving averages cross.
Also, when the 150-day EMA crossed below the 471 SMA *0.475, the price of BTC bottomed for the market cycle. Over the past two bottom cycles before the recent flash, the indicator has been accurate to within three days.
Flaws With The Pi Cycle Indicator
Based on the above explanation of how the developers of the Pi indicator came about, the figures that ensured it was able to predict the tops and bottoms of BTC, there is a problem since they were tweaking the settings of the MA to see which combination multiplied by Pi would fit the bottoms or close enough to those of 2015 and 2018. This phenomenon is known as curve fitting.
Curve fitting is described as a scenario where random market noise forms random patterns in price data which a trader/investor might consider as an edge without realizing it’s a product of sheer randomness.
When you engage in curve fitting, you are not fitting your models to market behavior. Still, market data creates a significant discrepancy as market data doesn’t only consist of market behavior but also random noise. That said, for your model to be profitable in the future, the random patterns seen in the historical data must repeat themselves, which is next to impossible.
And for this reason, curve fit models are doomed to fail when it comes to living trading since, at its core, its optimization is unlikely to fit into future unknown data. Building Alpha defines this phenomenon better as falling in love with historical results when testing a trading/investment hypothesis only to come short in live trading.
They offer three tips to avoid the pitfalls of curve fitting; use out of sample data, ensure your strategy has enough occurrences or trades, and validate your strategy across other markets.
Returning to our Pi indicator, only two data sets have been used to map out the bottoms. They were chosen as the indicator was being built and tweaked to fit the bottoms.
How It Performs On Other Markets
When the indicator is applied to other markets like Ethereum, it’s clear that it doesn’t work, as seen in the chart below.
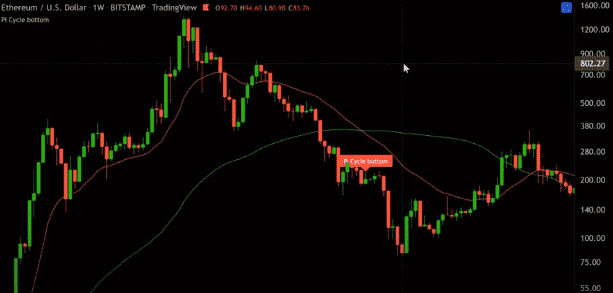
But this might be a bit unfair given that the indicator is designed for Bitcoin by tweaking settings to fit past bottoms, which is why it doesn’t work on Ethereum. Again, this brings us back to the curve fitting problem.
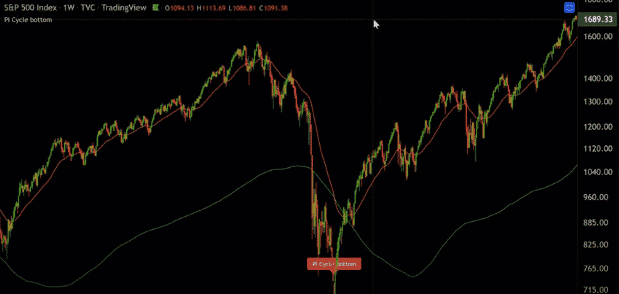
Interestingly the indicator accurately predicted the bottom for the S&P 500 back in 2009, as you can see below. However, that is the only signal it has given in that market.
Testing the indicator on other markets like NASDAQ and Dow Jones, there isn’t much success. And it’s the same case for other crypto markets like the LTC; it seems pretty inaccurate.
How To Best Use The Indicator
Based on these facts, this is a massive blow to anyone already getting worked up by the Pi indicator. And it’s easy to get excited, especially when you find that one formula or indicator that seems to work in a given market until it doesn’t. However, all hope is not lost. Like any other indicator, the Pi cycle indicator isn’t perfect. Still, it can be combined with other tools and indicators to guarantee a higher degree of success. Consider combining it with support and resistance, price structure, momentum, Elliot waves, etc.