What is Pivot Order Blocks?
Pivot Order Blocks are a type of technical analysis that is used by traders to try and predict future price movements of a security.
The theory behind Pivot Order Blocks is that larger institutional investors often place their buy and sell orders at certain price levels, which creates order flow imbalances that retail traders can exploit.
Pivot Order Blocks are created by identifying the most important support and resistance levels, which are typically at or near the Pivot Point, and then drawing horizontal lines to connect these levels. The Pivot Point is calculated using a security’s open, high, low, and close price from the previous period.
The Pivot Point is often seen as the center point of the market, and buy and sell orders placed around this level can significantly impact price. Pivot Order Blocks can be used on any time frame, but they are most commonly used on intraday charts.
When trading Pivot Order Blocks, traders will often look for order flow imbalances around important support and resistance levels. If there is a large order imbalance at one of these levels, it can signal that a move in price is imminent.
Pivot Order Blocks, like all other types of technical analysis, are not an exact science; thus, it’s crucial to keep in mind that in order to make better trading decisions, you need to combine them with other types of analysis. However, it is crucial to realize that Pivot Order Blocks are not an exact science.
How Does Pivot Order Blocks Work?
Pivot Order Blocks are a price action trading method based on pivot point reversals. Traders detect possible turning points in the market by looking at pivot points, which are locations of support and resistance that act as benchmarks for price action.
When a pivot point is breached, it is often seen as a sign that the market is about to move in the opposite direction. As such, Pivot Order Blocks can be used to trade both breakout and reversal setups.
In order to plot a Pivot Order Block, first, a pivot point must be identified. This can be done by looking for a candlestick with a high or low that is significantly higher or lower than the surrounding candles.
Once a potential reversal candle has been identified, a box will be plotted on that candle’s open and close values. The box represents the order block and can be used to enter into trades when the market breaks out or reverses from that level.
Use Case Of Pivot Order Blocks
Traders utilize something called a pivot point as an indicator of future price movement and to mark levels of support and resistance. A market’s pivot point is determined by taking the average of significant prices gleaned from the market’s activity throughout the preceding trading period.
Pivot points may be used alone or in conjunction with other technical indicators such as Fibonacci retracements, candlestick patterns, or moving averages to identify potential reversals in price direction.
Pivot points are used by day traders, swing traders, and position traders alike and can be modified to fit each trader’s unique trading style. For example, a day trader might look for price to reverse at the first level of resistance after it has broken through a pivot point.
A swing trader might enter into a long position if price breaks through the resistance level and then retraces to the support level. A position trader might use the daily pivot point levels to calculate target profit areas on a longer-term trade.
The use case of pivot order blocks is two-fold: first, to help identify potential reversal areas in price; and second, to provide entries, exits, and profit targets on trades.
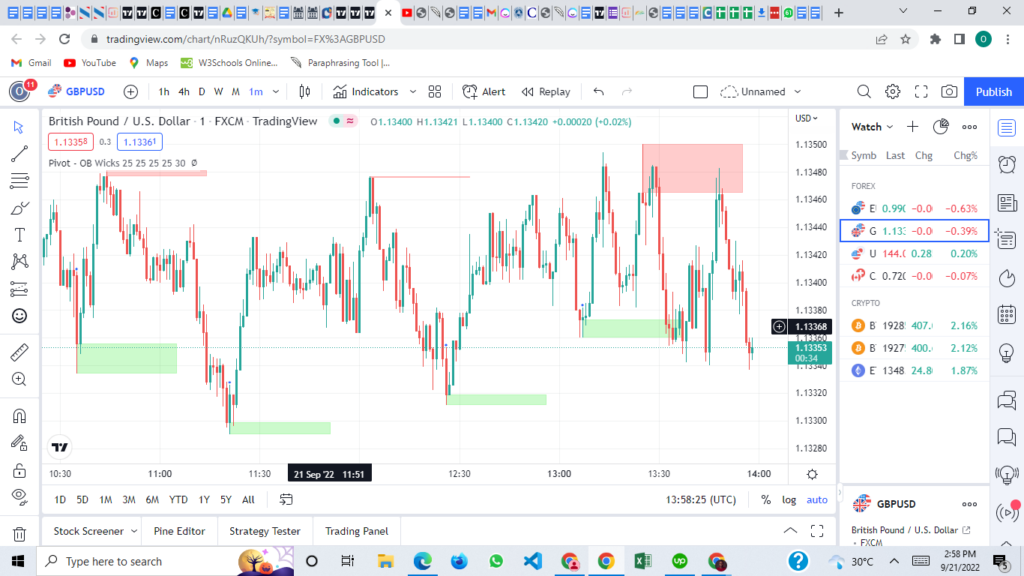
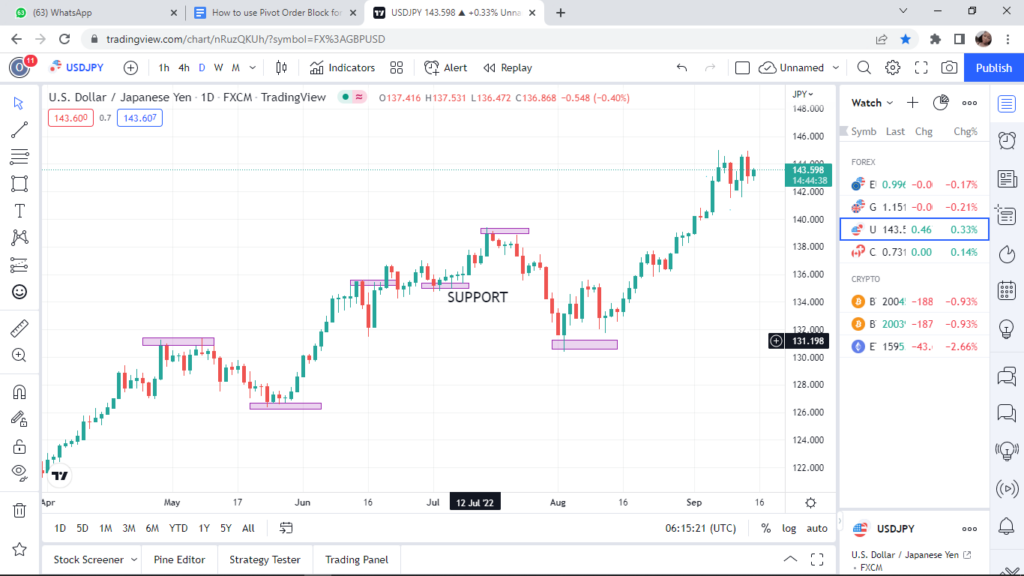
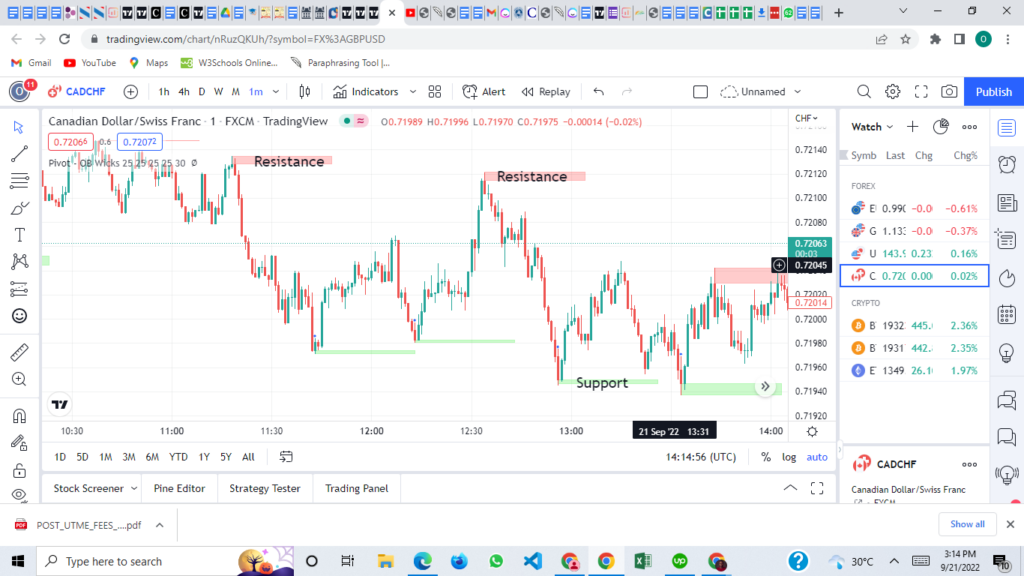
You can use the pivot candle to identify potential resistance zones on a price chart, where a reversal in price might be in the works.
In addition, stop loss orders could be placed below the support level if going long or above the resistance level if shorting the market.
When using pivot order blocks, it is important to remember that price does not always reverse at these levels; rather, these areas provide potential opportunities for price to do so.
As such, it is recommended that traders wait for confirmation before entering into any positions; for example, waiting for price to close above resistance on a long trade or below support on a short trade.
Trade management should also be considered when using this technique, as each trader’s risk tolerance and profit goals will vary.
How to Use Pivot Order Blocks
The Pivot Order Blocks is a powerful tool that can be used to identify potential areas of support and resistance. Although the indicator is relatively simple to use, it is important to understand how it works before using it in live trading. The following is a step-by-step guide on how to use the Pivot Order Blocks indicator.
- The first step is to identify the most recent high and low price points. These points will be used to calculate the width of the order blocks.
- Next, the height of the order blocks is calculated by taking the difference between the high and low points.
- The width and height of the order blocks are then used to determine the location of the potential support and resistance levels. These levels are typically located at or near the outer edges of the order blocks.
- Once the support and resistance levels have been identified, they can be used to enter and exit trades accordingly. It is important to keep in mind that these levels are not exact and should be used as guidelines rather than hard rules.
The Pivot Order Blocks indicator can be an extremely useful tool for identifying potential trading opportunities. However, it is important to understand how it works before using it in live trading.
By following the steps outlined above, you can start using this indicator with confidence in your own trading strategy.
Ways of Calculating Pivot Points
Pivot points are important levels that technical traders watch. These levels show where price action is likely to stall or reverse. day traders often use pivot points to find intraday trading opportunities. There are several different methods of calculating pivot points.
The most common method is the Traditional Pivot Point calculation. This method uses the previous day’s high, low, and close to calculate the pivot point for the current day.
Pivot point (P) = (Previous High + Previous Low + Previous Close)/3
S1= (P x 2) – Previous high
S2 = P – (Previous High – Previous Low)
R1 = (P x 2) – Previous Low
R2 = P + (Previous High – Previous Low)
Where:
S1= Support 1
S2 = Support 2
R1 = Resistance 1
R2 = Resistance 2
The Fibonacci Pivot Point calculation uses a slightly different formula, weighting the pivot point more towards the previous day’s close. The Woodie Pivot Point calculation also uses a different formula, weighting the pivot point more towards the previous day’s open.
There are also the Classic Pivot Point, Camarilla Pivot Point, and DeMark Pivot Point calculations. Each of these methods has its own strengths and weaknesses. The best way to use pivot points is to combine them with other technical indicators to find tradeable situations.
How to Successfully Trade Pivot Points?
Many traders believe that the key to successful Forex trading is to identify major turning points in the market correctly, and this is where pivot points come in. Pivot points are levels of support and resistance calculated using the open, high, low, and close of the previous period.
By correctly identifying these levels, traders can enter the market at key turning points and ride the following trend until it reaches the next level of support or resistance. However, correctly identifying pivot points is not always easy, and many traders end up losing money by entering the market at the wrong time.
Here are some tips on How to Trade Pivot Points Successfully
The first step is to calculate the main daily pivot point. This can be done by taking the average of the day’s high, low, and close. Once you have calculated the main daily pivot point, you can then use this information to identify potential entry and exit points for your trades.
For example, if the market is currently trading below the main daily pivot point, you may want to look for short-selling opportunities. Conversely, if the market is trading above the main daily pivot point, you may want to look for long-buying opportunities.
In addition to using the main daily pivot point to identify potential entry and exit points, you can also use it to set stop-loss orders. A stop-loss order is an order sent to a broker to sell a currency pair if it hits a predetermined price.
By placing a stop-loss order below the main daily pivot point, you can protect yourself from large losses if the market unexpectedly turns against you.
Finally, paying attention to other technical indicators when trading pivot points is important. These indicators can help you confirm whether or not a potential turning point is likely to occur.
For example, if you see that the Relative Strength Index (RSI) is overbought or oversold, this may signify that a reversal is about to occur. As such, paying attention to multiple technical indicators will give you a better chance of correctly identifying major turning points in the market.
By following these simple steps, you can learn how to trade pivot points successfully and improve your overall Forex trading results.
Advantages of the Pivot Point
Helps Identify Market Trends
As we mentioned earlier, one of the key advantages of using pivot points is that it helps traders identify market trends. By applying pivot point analysis, traders can get a clear picture of what is happening in the market and make more informed decisions about their trades.
Easy To Use
Another great thing about pivot points is that they are very easy to use, even for beginners. All you need is the previous period’s high, low, and close price, and you can quickly calculate all the key levels using any one of the various formulas available.
Time Frameless
Unlike other technical indicators, which are only applicable to specific timeframes, such as moving averages or Bollinger Bands, pivot points can be used in any timeframe. This makes them versatile and suitable for use in different trading strategies.
Useful In-Range-Bound Markets
Pivot point analysis can also be effectively used in range-bound markets where prices oscillate between support and resistance levels without any clear direction. By correctly identifying these levels, traders can make profits by taking advantage of these price movements.
Thus we can see that there are many advantages to using pivot points in trading, which is why they remain one of the most popular technical indicators among traders across all markets today. If you’re looking to add another tool to your technical analysis arsenal, then consider giving pivot points a try.
Conclusion
So, what are Pivot Order Blocks? In short, they’re a tool that can help you take advantage of market opportunities and capitalize on trading success. But how do they work? And more importantly, how can you use them to your advantage in the markets?
As we mentioned earlier, pivot order blocks are essential to any successful trader’s arsenal. They allow you to trade with greater precision and confidence by giving you a clear action plan for each potential trade scenario. By using pivot points as your guideposts, you can enter into trades with greater certainty and avoid costly mistakes.