What is Divergence?
Divergence occurs when an asset price moves opposite the underlying trend indicator. Therefore, divergence occurs when the price of a forex pair, commodity, or stock diverges from the technical indicator in the chart.
Divergence occurs when the price hits a new low or high, resulting in fading momentum in the given direction. As the momentum wanes, the indicator starts to move in the opposite direction instead of moving up or down in line with the underlying price trend.
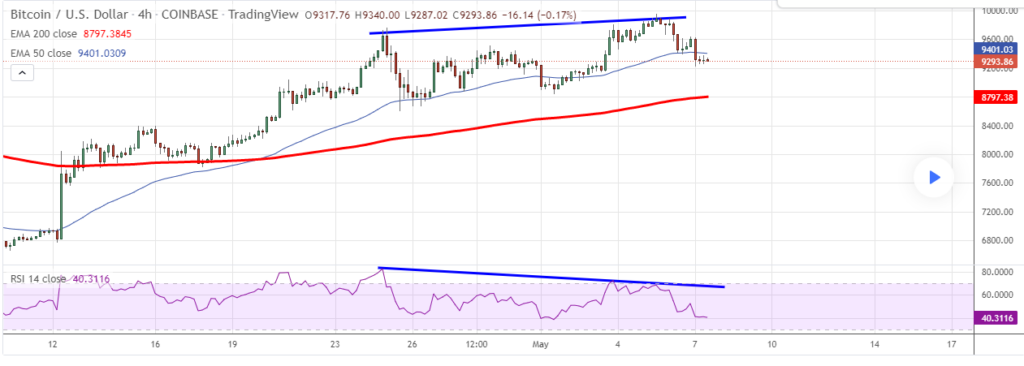
In the chart above it is clear that price increased even as the RSI indicator moved lower affirming the divergence between price and the indicator.
A technical indicator moving in the opposite direction to the underlying trend only goes to affirm a potential trend reversal. For instance, the Moving Average or Relative Strength Index often moves in the same direction as the underlying price.
However, when the two indicators start moving lower instead of edging up as the price, it affirms that the upward momentum is waning. The prospect of price changing course and moving lower is usually high.
Similarly, suppose the price was making lower lows as part of a downtrend. In that case, it is also expected that the moving average and Relative Strength Index indicator will also make lower lows. However, whenever the two technical indicators change course and start moving up, the prospect of price reversing and starting to move up is usually high.
Some of the indicators used to confirm divergence in technical analysis include:
- Relative Strength Index
- Stochastic
- Moving Average Convergence and Divergence
- Williams Percent R
What Does Divergence Tell
Divergence is one of the most vital trend reversal signals that allow technical analysts to prepare in advance for the start of a new trend. Whenever an indicator diverges from price, it affirms waning momentum in a given direction.
Whenever there is a steep uptick in price in the chart, it affirms that bulls have bought the market significantly, and some are starting to exit. The bulls closing positions at the top of the chart affirm their belief that the price has increased incredibly, and it is time to lock in profits. On the other hand, it could also be a sign that the market has hit a strong resistance level and is unlikely to continue moving up.
Likewise, if the price was moving lower as part of a downtrend and the indicator diverged from the price, it implies waning downward momentum. It could signify that short sellers are exiting the market to lock in profits after pushing prices lower. Additionally, it could mean that the price has hit a fundamental support level whereby short sellers struggle to push the price lower.
However, divergence should never be used as an entry signal. It is simply a warning sign of a potential trend reversal. Using other indicators or patterns is vital to ensure the trend is reversing. For instance, if the price was in a downtrend, and divergence occurred, the emergence of a bullish engulfing candlestick pattern would confirm that bulls have overpowered bears and are starting to push prices higher from the downtrend.
In addition, if the prices were in an uptrend and divergence occurred, a bearish engulfing candlestick pattern at the top of the chart would assert trend reversal. The bearish engulfing pattern confirms that bears have overpowered bulls and are starting to engineer a move lower from the uptrend.
Instant RSI Divergence
The relative Strength Index is one of the best indicators for determining areas of price reversals due to divergence. The indicator comes with readings of between 0 and 100. Whenever the RSI indicator is above 50, the underlying asset is considered bullish and likely to continue making higher highs as part of the underlying uptrend.
The underlying asset is considered overbought when the RSI reading is above 70. What this means is that the price has increased significantly. Whenever the overbought conditions kick in, divergence and reversal are the probable outcomes. The prospect of price reversing from the overbought condition and moving lower is usually high.
Very few buyers are usually willing to continue buying when an asset is overbought, thus sustaining the upward momentum. Instead, most start to lock in profits and exit the market resulting in the upward momentum fading. As the momentum fades, the trend indicator diverges from the uptrend and starts moving lower affirming divergence.
Likewise, whenever the RSI reading is below 50, the underlying asset is considered bearish and likely to continue making lower lows as part of the downtrend. Additionally, the price is deemed oversold whenever the asset price falls significantly to the extent of the RSI reading plunging below 30.
Oversold conditions kick in whenever an instrument is sold too much at a given period. Divergence and trend reversal occurs whenever the underlying asset is considered oversold. Exceptionally few sellers would be willing to continue trading at the new lows. Therefore, the selling momentum fades, resulting in divergence, with the trend indicators moving in the opposite direction.
Bullish vs. Bearish Divergence
A bullish and bearish divergence occurs at the extreme ends of a price chart, signaling areas of a potential trend reversal. For example, a bullish reversal occurs whenever the price has moved lower significantly, with the RSI indicator deep in oversold territory below the 30 level.
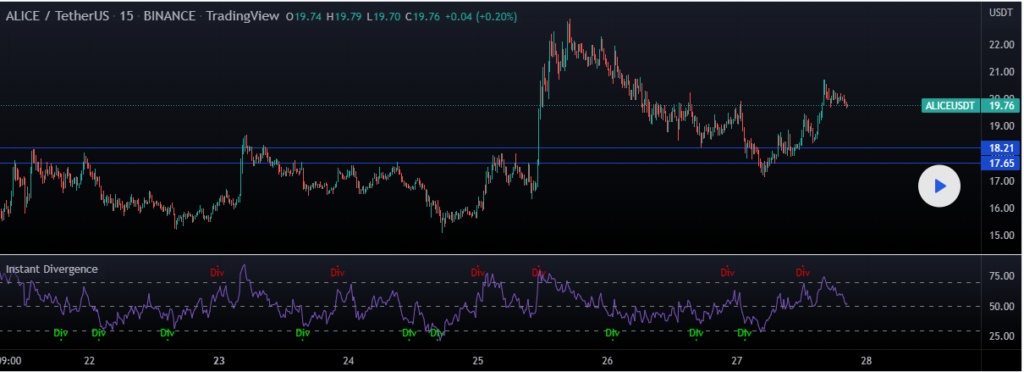
In the chart above, areas of bullish reversal are indicated in green in the RSI indicator. The price tends to bounce back and increase after the initial sell-off whenever the RSI reading is at around 20.
On the other hand, a bearish divergence occurs when the price has increased significantly due to too much buying. Therefore, it appears at the top of the chart when RSI readings are above 70. The divergence asserts waning upward momentum signaling the entry of short sellers in the market
The chart above depicts bearish divergence by “red Div.” It is clear that as soon as bearish divergence emerges, prices tanks and move lower, affirming a buildup in selling pressure.
How to Trade RSI Divergence
When it comes to trading divergence, it is crucial to define several things. Initially, it is essential to be aware of the prevailing trend. A moving average indicator can help ascertain whether the market is trending up or down. For instance, if the price is above the 200-day moving average, the asset is trending up. Conversely, the market is trending lower if the price is below the 200-day moving average.
Support and resistance levels provide valuable insights into where bearish or bullish divergence will occur. Near a resistance level, traders should watch out for bearish divergence, and near support levels, traders should look out for bullish divergence.
Once divergence is spotted, it is crucial to define what it is indicating. For instance, bearish divergence should signal the likelihood of price reversing from an uptrend to a downtrend and bullish divergence from a downtrend to an uptrend.
Wait for a confirmation pattern to be sure that the price is reversing from the underlying trend. The emergency of bullish and bearish engulfing patterns would affirm trend reversals.
How to Trade Bearish Divergence RSI
The chart below shows gold spot price action. In the first half, it is clear that the price was moving lower but reached a level of strong resistance and started moving up as part of a bounce-back play. As price made higher highs as part of the bounce back, so did the RSI indicator.
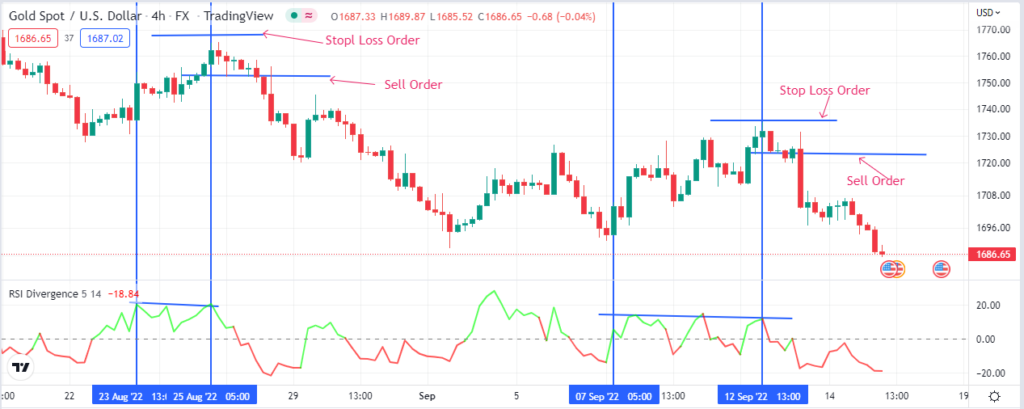
However, between August 23 and August 25, the RSI did not increase or make higher highs as the price rose as part of the emerging uptrend. The disconnect between price and the RSI indicator affirms divergence.
It is clear that After August 25, the price started moving lower after the formation of two bearish candlesticks. The two bearish candlestick forming as RSI failed to move higher affirms trend reversal from the uptrend. Price dropped as short sellers used the opportunity to enter short positions.
After the two bearish candlesticks formed, the opening of a sell position allowed traders to ride the emerging downtrend and generate significant profits. The stop loss order, in this case, was placed a few pips above the previous high.
Likewise, between September 7 and September 12, XAUUSD moved up, making higher highs. However, the RSI indicator lost momentum and started moving lower. The formation of a bearish engulfing candlestick at the top only affirmed divergence, thus reversal from the uptrend. Price tanking followed as short sellers used the opportunity to open short positions after the bearish engulfing candles that asserted bears were in control.
Trading Bullish Divergence RSI
In the BTCUSD chart below, it is clear that the price is in a downtrend in the first phase, making lower lows, with RSI also moving lower. However, starting May 13, RSI changed course and started moving up after dropping to lows of 22. The RSI starts moving up even as the bitcoin price moves lower.
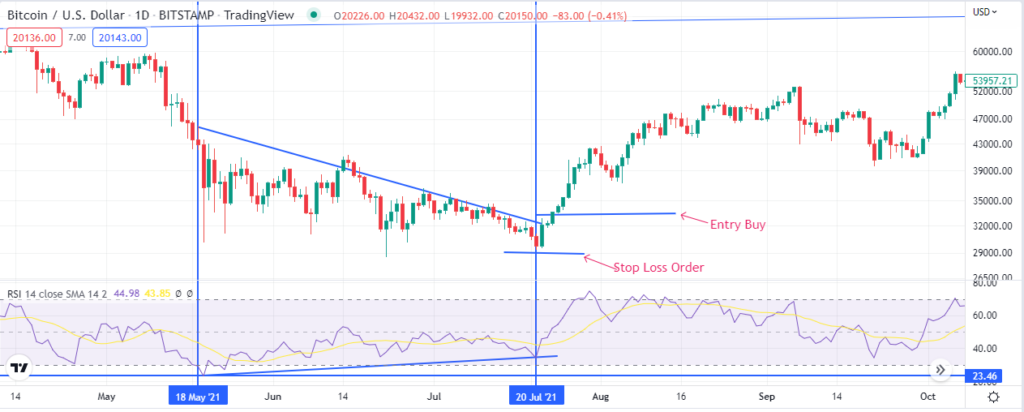
The RSI rose to near the 50 level even as Bitcoin price showed signs of weakness and continued moving lower. Nevertheless, on June 20, after Bitcoin had dropped significantly, the bullish engulfing candlestick emerged.
The big bullish candlestick on the daily chart affirms that buyers have overpowered bears following the divergence. What follows is the price starting to trend up. Price breaks out of the bearish trend as part of the bullish divergence pattern and moves up.
Traders used the opportunity to enter a long position as soon as the bullish engulfing candlestick closed. As a result, the stop loss order to avert the risk of incurring losses on price changing course and moving lower was placed a few pips below the lowest level.
RSI Divergence Pivot Levels
One of the downsides of relying on highs and lows to find divergence in charts is that one can end up with signals all over the place. Therefore, knowing the perfect reversal pattern that is likely to hold and generate the best trading opportunities might be challenging.
In the chart above, it is clear that there are so many levels of bearish and bullish divergence as depicted by green and red “div.” Some divergences end up generating short-term trading signals, while others end up generating long-term signals.
The best way to sieve divergences likely to hold and avert failed reversals is to use a Pivot finder to stay clear of failed breakouts.
In this case, the Pivot refers to strong resistance and support areas. Once divergence occurs near support and resistance level, the likelihood of the price reversing and moving in the opposite direction is usually high.
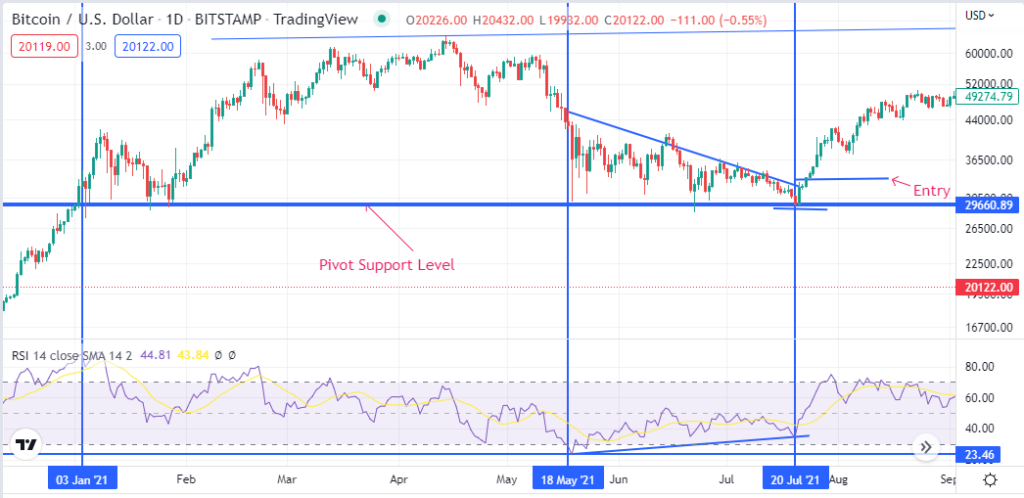
In the Bitcoin chart above, it is clear that the $29,660 was a critical support level whereby bitcoin price failed to drop at the start of 2021 on more than three trials. The strong support level acted as a pivot whereby bulls came into the fold and steered the price up.
Consequently, the emergence of divergence near the Pivot level at the start of May 2021 only affirmed that the divergence would result in a solid bullish reversal signal. As a result, Bitcoin struggled to move below the $29,660 level, which acted as a substantial Pivot area between May and July.
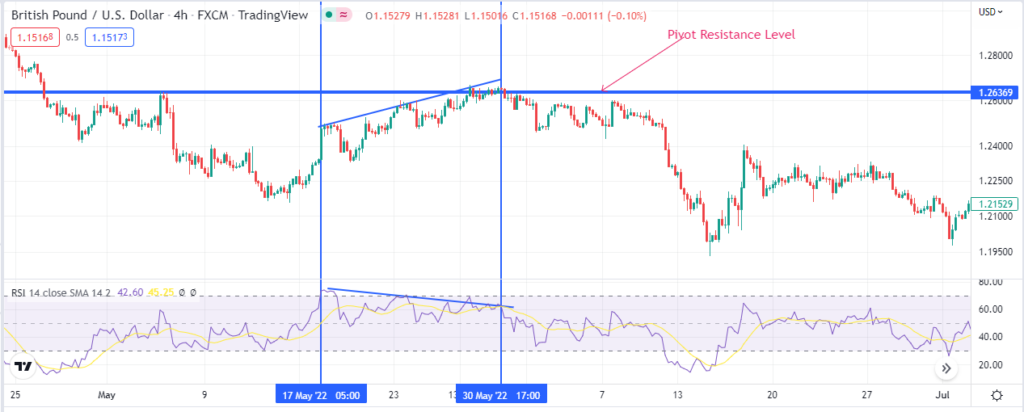
In the GBPUSD pair chart above, it is clear that the 1.26 area was a strong resistance level starting in May. However, the price struggled to move above this level. Therefore, as the price started increasing mid-May, divergence occurred, with the RSI failing to move up even as GBPUSD continued to make higher highs.
The 1.26 area acted as a strong resistance level or Pivot, whereby a reversal from the emerging uptrend occurred as part of the bear5ish divergence play.
Bottom line
Divergence is a common occurrence in technical analysis when trading various financial instruments. The RSI indicator is a powerful tool for ascertaining divergence ideal for trading trend reversals. Therefore, it is essential to use other technical indicators to confirm trend reversal whenever the RSI hints at potential price reversal.