Golden Pocket Trading Ultimate Guide
Watch the video we’ve made (including a totally free usable golden pocket script):

Using Golden Pocket in Your Trading
The golden pocket’s history dates back to the ancient Greeks and Egyptians. Later on, Leonardo Fibonacci discovered a big sequence of numbers named after him, i.e., Fibonacci Intervals.
Over the years, traders have found major Fib levels that work on the price action charts and compliments. The magic numbers are 23.6%, 38.2%, 50%, and 61.8%. Many other levels are also used, which some may regard as over-complication.
Pros
- Can be used as a good measure of support and resistance
- Have a high winning probabilities
- Multiple levels can be plotted as per liking
Cons
- It May be complex for beginners to understand and use
Time Frame and the Golden Pocket
The effectiveness of the numbers remains the same in different time frames. The support and resistance levels will remain constant whether you are on the M5 or the daily chart. Remember that the higher periods are more dominant over the smaller ones. You can plot the Fibs on the weekly chart and then go over to the lower intervals to take a proper entry.
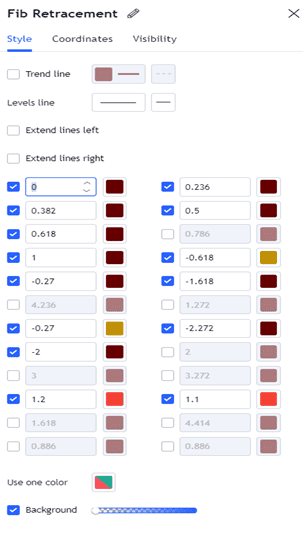
Image 1. The retracement levels can be customized as per your needs. As mathematicians have already figured out the correct numbers that work on the markets implementing a custom number will be a poor practice.
Nowadays, traders can also activate their Fib indicators over a certain time interval and analyze them from a different period. For example, the retracements on the hourly chart can be looked after from the daily interval.
Possible Stages of the Golden Pocket
Predicting the price action before it forms on the charts is a common practice of professionals sitting in hedge funds and big institutions. You can use the negative or pocket numbers with the golden pocket or fibs to predict the next movements. Let us discuss the appropriate scenarios here:
- Negative numbers. As the market trends downwards, it will continue to rest itself on the negative points, which in our case are -27% and -61.8%. To extend the talk further -161.8% and -200% are also some levels to consider.
- Positive numbers. As the price moves in an uptrend, it can face some resistance across 110%, 120%, and 161.8%.
Keep in mind that the measurements on the chart simply reflect human behavior. Fibs are an excellent way to predict the market structure if properly used.
How many days can it take for the market to reach the desired Fib level?
The market volatility governs its movement and the time required to reach a specific Fib level. Sometimes it can shoot across a specific interval due to incoming news or global mishap. The moments where it is approaching the point slowly are best as traders have plenty of time to capitalize on the situation.
Combining Golden Pocket with other indicators
Using multiple trading indicators can greatly improve your odds of success in trading. The Fibonacci sequence can be readily combined with other algorithms in various instruments for trading. For clarification, let us go through some of the vital ones.
Moving averages and Golden Pocket
Moving averages and the Fibonacci intervals can be applied for trend measurements. A 21-period MA pointing in an upward direction shows a bullish trend. The respective retracements and pullbacks can then easily be gauged with the help of golden pocket numbers.
Some traders may use multiple moving averages with the Fibonnacis to get further clarification on trades. This is mainly done on the professional level. As a beginner, you would like to keep the charts as clean and simple as possible.
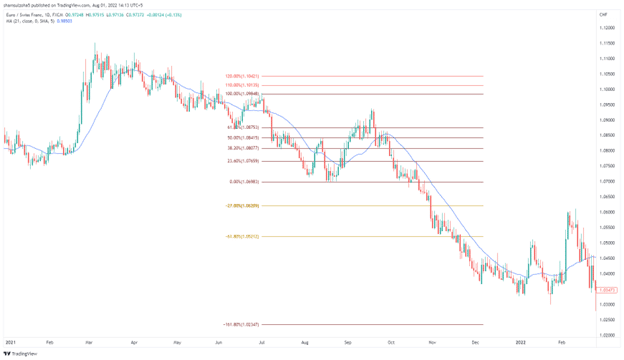
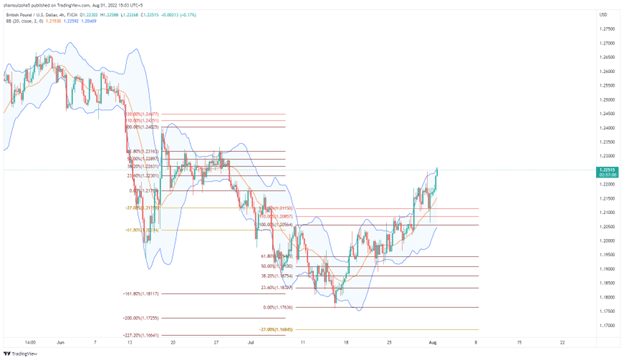
Image 2. The 21-period moving average is plotted alongside the Fibs. Notice how the market rests on the vital 50% level as it faces a pullback while trending downwards. A short position at this level with a stop loss at 110% and a take profit at -161.8% would give a risk-reward scenario of at least 1:1.
RSI and the Golden Pocket
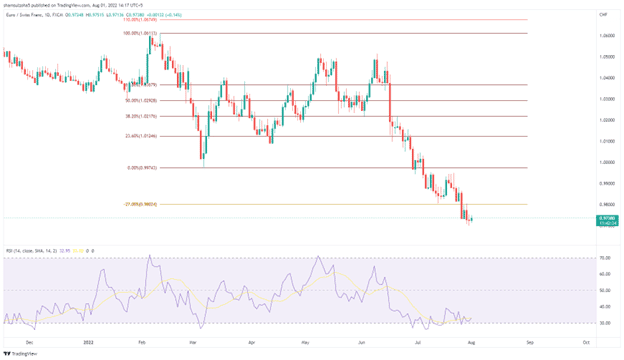
The median pullbacks between the long-term short trend can be coupled up with the overbought and oversold signals from the RSI indicator.
Similarly, we can also use the relative strength index alongside the fibs to see the next possible support and resistance levels.
Death Cross and the Golden Pocket
The death cross is a major indicator of the incoming downtrend. It happens when the 50 MA crosses over the 200 MA from above. While it may be hard to predict a death cross using Fibonacci intervals, we can still make some observations that could help us take an eligible entry.
Recalling from the moving average and the golden pocket paragraph, the MAs are in line to determine the market trend. While the 200 MA will take time to change direction, the 50 MA is suitable for tracking the crossover. Using the Fibs, we measure out if the price is nearing a certain point of concern that would negate the incoming point of intersection.
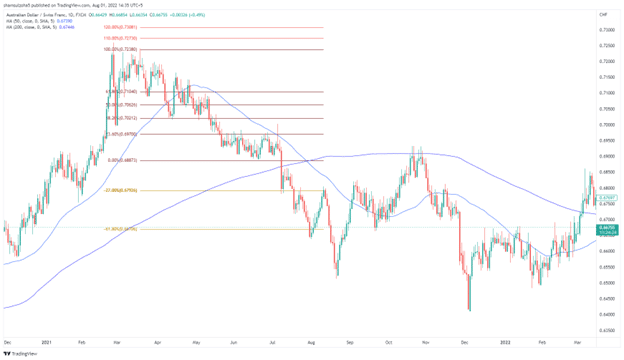
Image 4. As the moving averages face a crossover, we plot our retracement levels on the daily chart at AUDCHF. The price shows some support at -27% however moves forward to complete the intersection at -61.8%.
Bollinger Bands and Golden Pocket
The volatility observed using the Bollinger Bands can be a good indicator to understand if the market will respect our Fib retracements. An increasing distance between the two bands is surely a point to know that the price action will not hold up to the vital 38 or 61% sequences.
Take out the Fibonacci indicator and plot them when the Bands are squeezing after a sudden expansion. As mentioned before, the retracement will help you by leaps and bounds in determining the possible resting points.
The slight squeeze can point to a new market structure which can be measured with a separate set of Fib levels. While this may clutter your charts with lots of knowledge, it can help with scalping techniques.
Candlestick Patterns and the Golden Pocket
A bearish engulfing pattern on a downtrend at a 61.8% retracement is a good indicator of where the market is heading. With time frame correlation techniques, we can also dive down onto lower intervals and confirm the price action patterns alongside Fibs for a better entry.
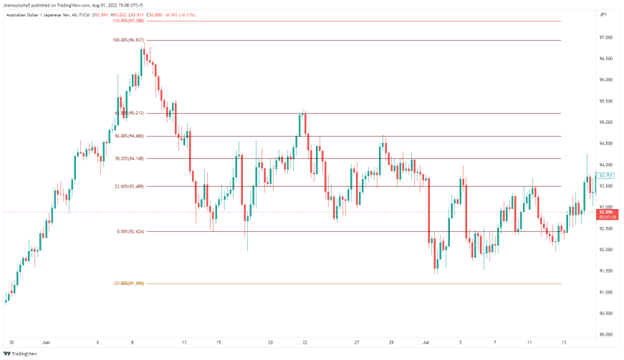
Image 7. The 61.8% holds for the recent short trend on the AUDJPY. The bearish engulfing pattern guides the price action towards the -27% levels.
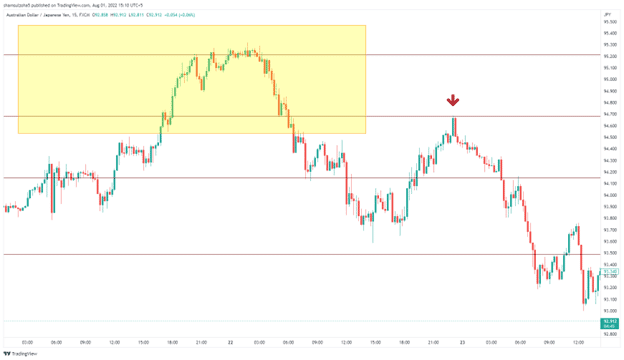
Image 8. From the 4-hour, we jump straight to the 15-minute charts and see the highlighted yellow area. The red cross shows a perfect point of entry here. The market retraces to 61.% falls and then goes back to the 50% level. After a clear bearish engulfing pattern, it moves onto the lower levels.
All the bearish and bullish candlestick patterns can be used with the Fibs and other indicators to get the correct trading levels.
Fundamentals and Death Cross
The 50% retracement of Dow Jone in the pre-pandemic era gave a good measure to an ending bullish stock market. While Fibs cannot predict the true outcome of global economic events, it can act as a tool to predict the sudden incoming shifts in the market. It is advised to trade instruments with high volume and those not subjected to an immediate change in price action.
Can we use the Golden Pocket on all instruments?
Fibonacci is a diversified tool that can be used on almost all trading instruments. As mentioned before, choosing an asset with a smooth movement with enough volume is better. Similar to other trading indicators, it is essential to note that the random nature of the market can provide false signals. We can only predict the best levels in the golden pocket series, which have a high chance of working.
Managing Risk while Trading Death Cross
Astute risk management will ensure that your golden pocket strategy is viable in the long run. The retracement numbers are regularly used for determining the stop loss and take profit levels for trades.
- -27%. A great point to close your trades and take your profits from trades opened according to the current trend.
- -61.8%. If you didn’t close your position completely at the -27% level, the -61.8% is the level to look out for. The market can bounce off at this point to retrace up to 0% or more.
- 6%. The initial retracement of the market. Good for closing out your trades if you are in the current trend.
- 2%. A major point of support or resistance. The market may move back to the initial trend from here. It is possible to add to the initial trade here with the stop loss above the initial entry.
- 50%. This is regarded as a point of no conflict. The price may move up or down as there are no guarantees of continuation or a pullback.
- 8%. Another vital area next to the initial 38.2% level. Again you can add to the initial trade or use it as a stop loss if you have opened trade at the 38% mark.
- 100%. A major point determines if the market will continue to move in the current direction or reverse to form a new trend. This can be a good point for a stop loss for traders who open up a trade at the 61.8% level. Consequently, the 0% will be the take profit for any such trade.
- 110%. The major stop loss point for all of your initial long or short trades that were following the previous trend. The violation of 110% is a slight guarantee that the markets are about to change their direction.
- 120%. The final confirmation line or the stop loss. This is the danger zone which is your last resort to get out of the trades opened according to the previous trend. After this level is crossed, you should look to place positions on the opposite side.
The Fib speed resistance arcs and the trend-based fib extensions are also good means to observe the golden pockets on the charts.
Summary
The golden pocket market analysis is based on pure mathematics and probabilities that work quite well. In the initial stages of trading, investors should always practice using a virtual portfolio to avoid facing losses. It may take some time to develop complete control over the Fibs; however, the rewards might be good once comprehended.