The Ultimate Support And Resistance Basics Trading Guide
Support and resistance is a highly discussed concepts in trading and technical analysis. Traders often use the terms to refer to price levels on technical charts that act as barriers to any asset class and are seen as an area with either a lot of supply or demand.
What is support and resistance?
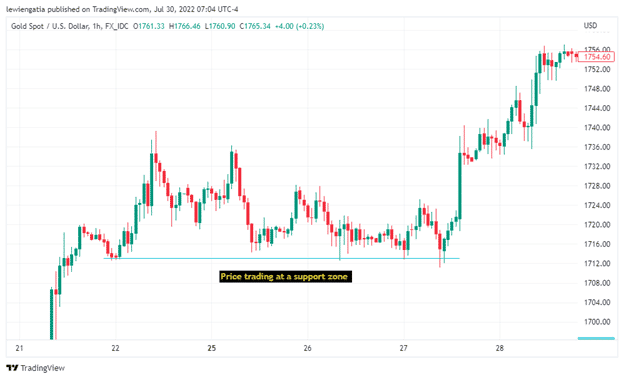
Support is a horizontal line or area on your chart where a trader should expect buyers to push prices higher. This means that price is in a strong supply zone.
On the other hand, resistance is a horizontal line or area on the charts where a trader should expect sellers to push prices lower. This means that price is in a strong demand zone.
(Image 1. A clear demonstration of price respecting a support zone on the 1-hour XAUUSD chart. Price bounces around this level before aggressively pulling away. Source: Trading view)
Traders remember the past and can anticipate future market movements using support and resistance. A technical chart can identify the levels using moving averages and trendlines. When the price trades back to significant support or resistance, it struggles to break through and often moves back in the other direction.
Eventually, the price may break through, but it will typically retreat from the level a few times before doing so. It should be noted that a level becomes more significant when the price tests the level’s support or resistance area several times.
Almost all the trading phenomena are based on support and resistance levels. The top indicators, such as Fibs, moving averages, RSI, etc., use the basic concepts available by these technical points to identify key areas on the charts.
(Image 2. A clear demonstration of price rejecting a resistance zone on the 1-hour GBPJPY chart. Price bounces around the resistance zone and then aggressively pull away from the level. Source: Trading view)
We can also interfere the important points of support with the image. Can you see how the price bounces off the 163 mark? As a technical trader, you would want to keep your eyes wide open when the market falls to this level again. It is better to plot a horizontal line beforehand and wait for the asset to come to the designated mark. Some investors will not take a buy right away but wait for further confirmations, such as a bullish candlestick pattern.
Using Support and Resistance in your trading
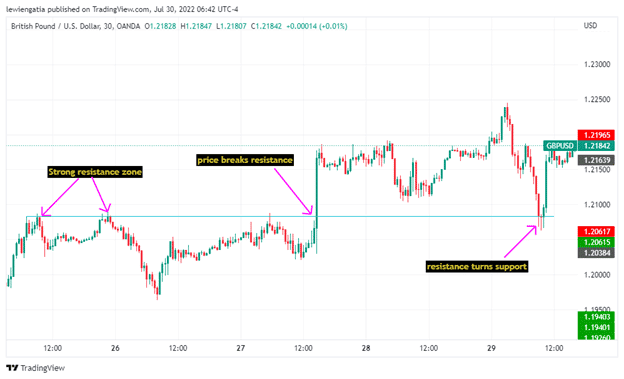
(Image 3:Chart shows how the price on the 30-minute chart on GBPUSD trades in a strong resistance zone and then later breaks it. The resistance later turns to a support level. Source: trading view)
Monitoring the breakout is considered the most effective to apply support and resistance. A breakout is when an asset class falls below or above support. It gets interesting as the two can swap roles i.e., when support breaks, it becomes resistance, and when resistance breaks, it becomes support.
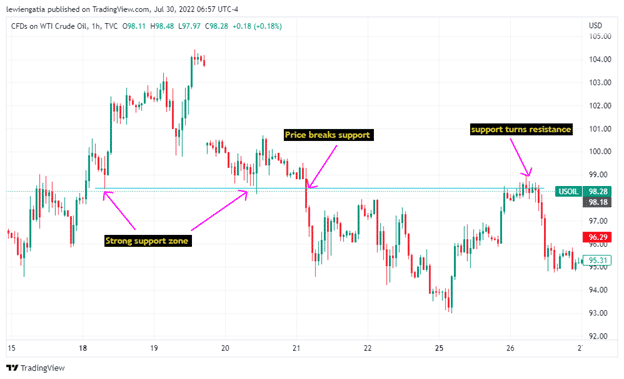
(Image 4. The chart shows how the price on the 1hour timeframe on USOIL trade on strong support then later breaks the support zone. The support zone later turns resistance. Source: Trading view)
Potential trading opportunities and analytical insights are often derived from major and minor support or resistance areas. When the price trades back to significant support or resistance area, it struggles to break through and may start ranging for a significant period. Traders can place respective buy trades on support and sell trades on the resistance.
Let us discuss some advantages and disadvantages of using support/resistance levels in your trading.
Pros
An easy indicator that works across all instruments and is easy to work with
Can be used to find out the key levels on the chart
It is not a lagging indicator
Cons
There can be many support and resistance areas on the chart. This can make it difficult to find the correct point
Moving Average and Support and Resistance
Incorporating moving averages in trading is an excellent way to predict future short-term and long-term market movements. Moving Average smooths out past price action and helps traders identify support and resistance areas.
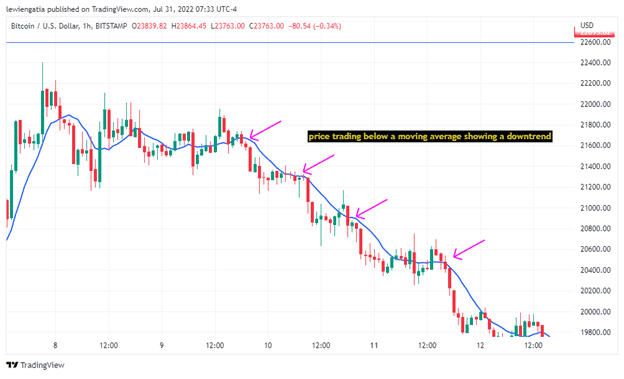
If the price is above the Moving Average, it is probably on an uptrend. As it clashes with a certain resistance, it might be possible to place a short trade. The opposite can be said for a long position.
(Image 5:price trades below moving average on the 1 hour on BTCUSD, showing it is on a strong downtrend. Traders can use this to anticipate future bearish and bullish price movements. Source: trading view)
One fundamental note traders should keep in mind is that the moving average is just like normal support and resistance lines. Therefore we can use them as technical analysis tools for predicting the possible points where the market will bounce off.
RSI and Support and Resistance
The Relative Strength Index( RSI) is a momentum-driven indicator used to measure the magnitude and speed of an asset’s recent price to determine undervalued and overvalued market conditions.
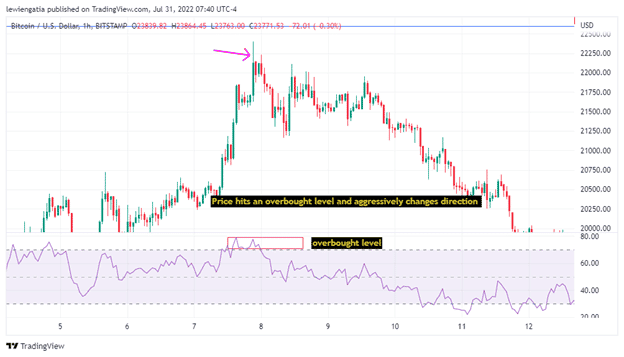
Support and resistance, and RSI give one a clear picture of where future price reversals may occur. For example, When the RSI indicator crosses 70 on the RSI chart, it is a bearish sign which accounts for a short trade, probably at a strong resistance area.
(Image 6:Chart shows price trading at an overbought level on the 1 hour on BTCUSD. Price aggressively changes direction as the sellers take over the market. Source: Trading view)
Fibonacci and Support and Resistance
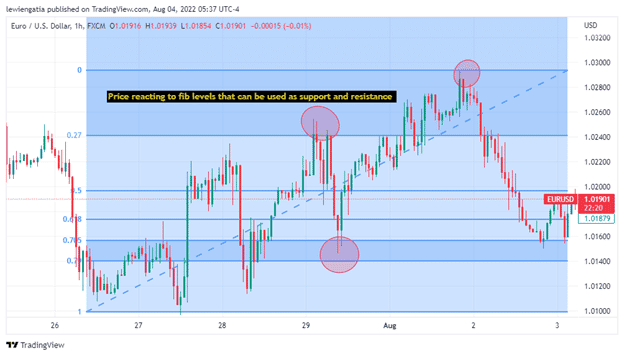
Fibonacci levels are horizontal lines indicating where support and resistance are likely to occur. The concept was created and first used by Indian mathematician Leonard Fibonacci, but the numbers and sequencing were used even before. The best way to use Fibonacci levels is by identifying support and resistance levels and checking if they align with the Fibonacci levels. If they align, the price point is seen as a significant level where a trader should expect trend reversals or breakouts and can be considered a strong point of interest.
(Image 7: Fibonacci can be an excellent tool to identify support and resistance. Using the levels, a trader can be able to anticipate where the price can reverse or change direction. Source: trading view)
Bollinger Band and Support and Resistance
Bollinger band is an essential Simple Moving Average( SMA ) developed by John Bollinger that measures market volatility and helps traders identify overbought and oversold levels. The collision of these bands with the designated support and resistance points can create some profitable trading opportunities. As the price touches the upper bands and meets a designated resistance zone, it might be possible to sell the instrument.
(Image 8: Using the Bollinger bands on the 1 hour on USD/CAD, a trader can spot overbought and oversold levels. After matching it with certain support and resistance levels, they can sell or buy depending on the satisfied conditions. Source: Trading view)
The expansion of bands indicates that the market volatility is high, increasing the chances that it will easily rip through the next level of support/resistance.
Candlestick Patterns and Support and Resistance
Pairing candlestick patterns with support and resistance as part of trading can be a great way to predict the price movement of any asset on the technical charts.
Some of the most common candlestick patterns and their pairing with the support and resistance levels are as follows:
Hammer and Support and Resistance
The Hammer is a bullish reversal pattern that shows rejection of lower prices after a decline in price and means that the buyers are in control of the market. When this candle forms, the price might be at a strong support zone
Shooting star and Support and Resistance
A shooting star is a bearish reversal pattern that forms after the price has advanced and shows sellers are in control of the market. When this candle forms price might be at a strong resistance zone, and traders should expect a move to the downside.
Bullish engulfing pattern and Support and Resistance
A bullish engulfing pattern is a pattern that shows buyers have overwhelmed the sellers. This pattern mostly forms at a strong support level and anticipates that the price may change direction to the upside.
Bearish engulfing pattern and Support and Resistance
A bearish engulfing pattern shows sellers have overwhelmed the buyers and majorly occurs after the price has advanced. This pattern mainly forms at a strong resistance zone and may indicate a downward move.
Plotting Trend Lines and Support and Resistance
The trend lines can be termed diagonal support and resistance lines. They form when the price repeatedly bounces off a particular area diagonally. This leads to the formation of a market structure.
Trend traders use the support and resistance levels during the price flow and pullbacks to place their positions. The trend lines can be easily plotted using the various lines available on the charting platform.
Compatibility of Support and Resistance
Support and resistance can work across all instruments and time frames on a price action chart. The effectiveness of these levels can change from one asset to another. Traders should note that these points act as zones rather than definite lines. It is not a solid statement that the price will rebound exactly at the designated support/resistance.
Managing Risk while Trading Support and Resistance
No technical indicator, including support, and resistance, is 100% accurate. There is always a cloud of losing trades regarding financial trading. Always use proper risk management while trading support and resistance zones to keep your chances alive and stay in the game for the long term. Top traders recommend not risking more than 1% on a single position.
Some Important FAQs
Can beginners trade using support and resistance?
Support and resistance are easy to spot on charts. They do not require significant technical knowledge and are available across all instruments. Some charting platforms may plot these patterns automatically. Confirm them manually before trading to avoid any major losses.
Where should I place my stop loss and take profit while trading support and resistance?
Your stop loss can be placed slightly away from the current trade direction beneath the support/resistance. The take profit can be placed across the next key level of market fluctuation.
What trading strategies are applicable with support and resistance?
The support and resistance levels can help out scalpers, day and carry traders alike. Each time frame will tell a different story. The levels can change according to each period.
Summary
By using support and resistance, a trader can anticipate points of interest on technical charts where the price has a probability of changing direction or halting. The best way to draw these levels is to be accurate by zooming out your charts which helps get a clear view and try to adjust your levels to get the most number of touches without second guessing.
Using these concepts alone is not enough for traders to become profitable. By adding indicators, one can get more confirmation on using past price action to anticipate future price movement. Using all of the indicators at one is not advisable as they can bring confusion and may overload your charts, making it unclear to see what exactly the price is doing.
Despite support and resistance, traders are advised to have a strict risk management plan as the price may not respect all the levels.