What is the ABCD Pattern in Trading?
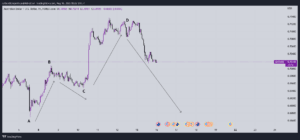
The ABCD pattern is a four-point price action formation that can be found on any timeframe from intraday charts up to weekly charts. The pattern has the following key characteristics;
A – The start of the pattern which is marked by a significant swing low.
B – The end of the first leg which is marked by a significant swing high.
C – The retracement which should be between 38.2% to 61.8% of the AB move.
D – The final leg which should be equal to the initial AB move.
This could be a bit difficult to grasp at first but let’s look at the details of identify it.
How identify the ABCD Pattern in Trading?
The ABCD pattern can be easily identified on a chart and once you know what to look for, it can be quite easy to spot However, there are a few things that you need to take into account before you can consider pattern as an ABCD pattern;
The first point, A, should be a significant swing low. This means that it should be lower than the two previous swing lows on the chart.
The second point, B, should be a significant swing high. This means that it should be higher than the two previous swing highs on the chart.
The retracement, C, should be between 38.2% to 61.8% of the AB move. This is an important level as this is where we will enter our trade.
The final leg, D, should be equal to the initial AB move. This is another important level as it will give us our profit target for the trade.
The psychology behind the pattern
The ABCD pattern is a great tool to use in trading as it can provide us with a clear and concise view of the market. However, it’s not just the technical aspects of the pattern that make it so useful. The psychology behind the pattern is also important to understand.
The first thing to note is that the pattern is created by human beings who are constantly buying and selling in the market. This means that there is a lot of emotion involved in the creation of the pattern. The second thing to note is that this pattern often occurs at key turning points in the market. These are times when buyers and sellers are both looking to enter or exit their positions.
Finally, the ABCD pattern can be used to help us make better trades. By understanding the psychology behind the pattern, we can make sure that we are entering our trades at the right time and with the right market conditions.
What are the benefits of using the ABCD Pattern in Trading?
There are numerous benefits to using the ABCD pattern in trading. The pattern can be used to;
1 Identify potential reversals in the market
When it comes to trading, one of the most important things that you need to be able to do is identify potential reversals in the market. This is where the ABCD pattern can be extremely useful. The pattern can help you spot potential reversals before they happen. This gives you a chance to enter your trade before the market turns against you.
2 Enter trades with a higher probability of success
Another benefit of using the ABCD pattern is that it can help you enter trades with a higher probability of success. This is because the pattern can help you identify key turning points in the market. These are times when there is a high likelihood of the market moving in your favor.
3 Exit trades with a higher profit potential
The final benefit of using the ABCD pattern is that it can help you exit trades with a higher profit potential. This is because the pattern can help you identify key levels where the market is likely to reverse. By knowing these levels, you can exit your trade before the market turns against you.
How to trade with the ABCD Pattern in Trading?
If you’re looking to trade with the ABCD pattern, there are a few things that you need to keep in mind. First, you need to make sure that you enter your trade at point C. This is the point where the market is most likely to reverse. Second, you need to make sure that you exit your trade at point D. This is the point where the market is most likely to move in your favor. Finally, you need to make sure that you use a stop loss. This will help you limit your losses if the market doesn’t move in your favor. If you don’t want to trade the pattern this way, you can use it in combination with other indicators.
4 Indicators to Use With the ABCD Pattern
There are four indicators that you can use with the ABCD pattern. These indicators are;
1 Relative Strength Index
The RSI is a momentum indicator that can be used to identify overbought and oversold conditions in the market. This is useful for trading the ABCD pattern as it can help you enter your trade at point C. For example, if the RSI is above 70, it indicates that the market is overbought. This is a good time to enter your trade.
2 MACD
The MACD is a moving average convergence divergence indicator. This indicator can be used to identify trend reversals in the market. This is useful for trading the ABCD pattern as it can help you enter your trade at point C. For example, if the MACD crosses below the signal line, it indicates that a bearish reversal is about to take place. This is a good time to enter your trade.
3 Fibonacci Retracement
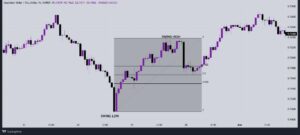
The Fibonacci retracement tool can be used to identify potential support and resistance levels in the market. This is useful for trading the ABCD pattern as it can help you exit your trade at point D. For example, if the market retraces to the 61.8% Fibonacci level, it indicates that the market is about to reverse. This is a good time to exit your trade.
4 Pivot Points
Pivot points are a technical analysis tool that can be used to identify potential support and resistance levels in the market. This is useful for trading the ABCD pattern as it can help you exit your trade at point D. For example, if the market retraces to a major pivot point, it indicates that the market is about to reverse. This is a good time to exit your trade.
Tips For Trading With the ABCD Pattern
When trading with the ABCD pattern, there are a few things that you need to keep in mind.
1 Trade In Line With The Trend
The first thing that you need to do is trade in line with the trend. This means that you should only enter your trade when the market is trending in your favor. For example, if the market is in a bullish trend, you should look out for bullish ABCD patterns. This can help you increase your chances of success.
2 Use A Stop Loss
Another thing that you need to do is use a stop loss. This will help you limit your losses if the market doesn’t move in your favor. For example, if you’re trading with a stop loss of 10 pips, you’ll only lose 10 pips if the market doesn’t move in your favor.
3 Look Out For Confluence
Confluence is when two or more indicators line up. This strongly signals that the market is about to move in your favor. For example, if the RSI and MACD both indicate that the market is about to reverse, this is a good time to enter your trade.
4 Be Patient
Lastly, you need to be patient when trading with the ABCD pattern. This is because it can take some time for the market to move in your favor. For example, if you’re looking for a 1:2 risk-to-reward ratio, you may have to wait for some time before the market reaches your target profit level.
4 Factors To Consider Before Trading The ABCD Pattern
Now that you know how to trade with the ABCD pattern, there are a few things that you need to consider before trading it.
1 The Trend
The first thing that you need to consider is the trend. You should only enter your trade when the market is trending in your favor. For example, if the market is in a bullish trend, you should look for bullish ABCD patterns.
2 Market Conditions
Another thing that you need to consider is the market conditions. You should only enter your trade when the market conditions are favorable. For example, if the RSI is overbought, it’s a good time to enter your trade.
3 Your Risk To Reward Ratio
The next thing that you need to consider is your risk-to-reward ratio. This is the amount of money that you’re willing to risk for every dollar that you’re looking to make. For example, if you’re looking for a 1:2 risk-to-reward ratio, you should only enter your trade when the market has the potential to move at least two times your stop loss.
4 Your Exit Strategy
Lastly, it would help if you had an exit strategy. This will help you take profits off the table when the market moves in your favor. For example, you can use a trailing stop loss to lock in profits as the market moves in your favor.
Other Chart Patterns In Trading
Besides the ABCD pattern, there are other chart patterns that you need to be aware of. These include the following:
1 Head And Shoulders Pattern
The head and shoulders pattern is a bearish reversal pattern that can indicate that the market is about to reverse. The pattern is characterized by a high and two lower highs on either side.
2 Triple Top Pattern
The triple top pattern is a bearish reversal pattern that can indicate that the market is about to reverse. Triple tops are formed when the market tests a resistance level 3 times and fails to break higher. This is an excellent time to enter your trade.
3 Flag Pattern
The flag pattern is a bullish continuation pattern that can indicate that the market is about to continue in the same direction. It is characterized by two ascending or descending trend lines that are parallel to each other.
4 Pennant Pattern
The pennant pattern is a bearish continuation pattern that can indicate that the market is about to continue in the same direction. This is an excellent time to enter your trade.
FAQs About ABCD Pattern In Trading
1 What is the ABCD pattern?
The ABCD pattern is a chart pattern that can indicate that the market is about to move in a particular direction. It can be used to trade both reversals and continuation.
2 What are the benefits of using the ABCD pattern?
The main benefit of using the ABCD pattern is that it can help you enter trades with a high probability of success. This is because it takes into account both the trend and market conditions.
3 How do I trade with the ABCD pattern?
You can trade with the ABCD pattern by looking for bullish or bearish reversals. You should enter your trade when the market is in your favor and exit when the market moves against you.
Read more: