What Are Trading Indicators?
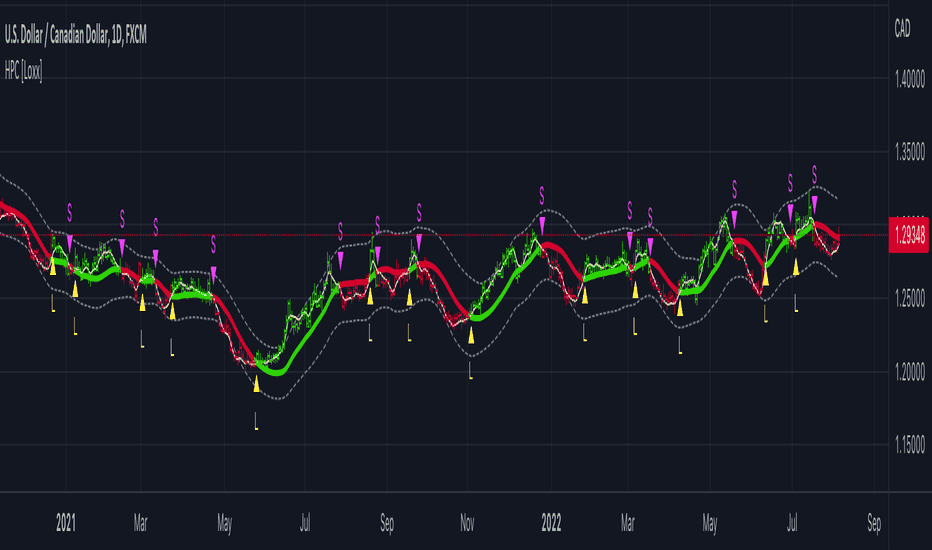
Trading indicators are algorithms developed to spot trends, zones, mathematical ratios, etc., in the market. Indicators analyze the price data and plot respective lines on the candlestick charts.

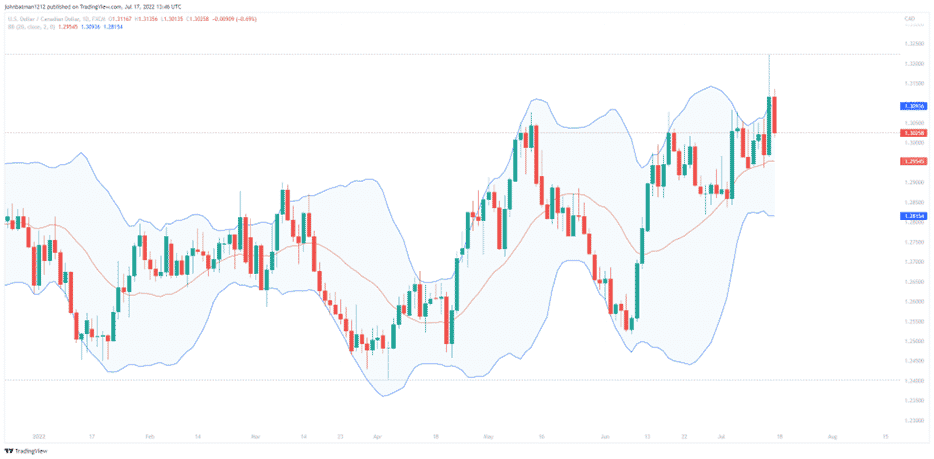
Image 1. A simple Bollinger band indicator is plotted on the daily chart on USDCAD. Source: TradingView.
Some common indicators include moving averages, momentum, trend lines, Fibonacci intervals, Bollinger bands, Double tops, and Ichimoku Kyonku. Many novice traders are in a deep search for the holy grail indicator. While there is no 100% winning EA in the marketplace, including specific algorithms can help boost your trading consistency.
Potential Benefits And Demerits Of Indicators
There are dozens of different indicators available, each with its own strengths and weaknesses. Let us go through some common benefits of these EAs:
· Consistency. Indicators can be a powerful tool for any trader looking to improve their market performance. Some indicators come with a built-in position calculator to help maintain your risk.
· Market direction. By tracking key indicators such as price, volume, and momentum, traders can better understand where the market is heading and make more informed decisions.
· Education. Beginners can use trading indicators to strengthen their knowledge of price action trading.
· Adaptability. Indicators can be used by scalpers, day, swing, and carry traders alike. The algorithm will show a different output depending on the selected timeframe. This is due to the fact that it formulates the result based on the characteristics of candlesticks or charts under observation.
· Automation. Trading indicators can be developed into fully customized algorithms that can trade the markets with full automation. They do not require human intervention at any stage.
Some cons can be summarized as:
· Complexity. Using a bunch of trading indicators on the same chart can complicate your technical analysis.
· Lagging. Lagging indicators such as moving averages do not predict the future of price action. They can only provide insight into past movements.
How Can You Use Indicators?
PineScript is the primary language used to create custom algorithms in TradingView. To add one to the charting platform, simply click on the indicators button on the top and select the EA of your choice.

Image 2. The arrowhead points to the place on the TV interface where you can access the indicators tab.
Read more:
- A Basic Guide to the On-Balance Volume Indicator
- Aroon Indicator and Its Technicalities
- What is the RSI in trading, And how to trade on it?
- Average True Range – A Basic Guide to trade this indicator
- Pi cycle indicator – Best Top and Bottom (Tried and Tested)
- Average Directional Movement Index (ADX)
- Bollinger Bands
- The Parabolic SAR
- What is Standard Deviation?
- Heiken Ashi Indicator
- Ichimoku Indicator
- Random Walk Index in Trading
- 5 Fibonacci Retracement Mistakes To Avoid At All Times
