Aroon indicator is a technical analysis tool used to predict a financial instrument’s reversal points. It can also be used to measure the strength of the current momentum. The indicator was developed back in 1995 by Tushar Chande. It is a combination of two algorithms, i.e., Aroon up and down. The value of the two will fluctuate between 0 and 100, indicating whether an asset is in a bullish or bearish trend.
While the indicator may seem complex for beginners, it is quite simple to understand. The algorithm can be perfect for those using price action techniques to trade. Let us go through some of the major technicalities of the EA to see how we can benefit from it.
Using Aroon Indicator in Your Trading
The Aroon indicator is made up of two lines or indicators whose values of which range from 0 to 100:
·Up. Helpful in indicating the uptrend or identifying the ranging periods.
·Down. Useful in figuring out the major periods in a bearish market.
Other than this, both indicators are useful in gauging the overall momentum of the markets. The following formula holds for calculating the Aroon indicator over ten days:
Aroon Up = (10 – No. of days since 10-day High) * 100 / 10
While the downside can be calculated as follows:
Aroon Down = (10 – No. of days since 10-day Low) * 100 / 10
Pros
·A good choice for determining the momentum and trends
·Easy to determine the current shift in the price action
·The indicator can be customized to a certain period
Cons
The indicator might confuse novice traders to some extent
Time Frame and the Aroon Indicator
The outlook for the Aroon indicator can change according to the time frame. It also depends on the value that traders choose for the period. For a 14 period, the indicator will measure the 14 previous candles for printing the up or down lines.
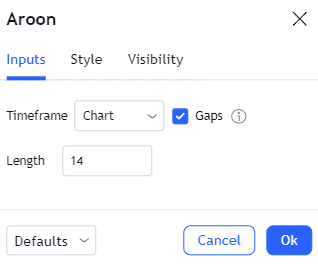
Aroon indicator can be set up easily on any chart. Generally, traders can easily adjust the gaps, time frame, and the period from the settings.
Image 1. The Aroon indicator settings can be adjusted as per the requirements of traders. Lower intervals are better for scalpers, while higher time frames can benefit swing traders.
Possible Stages of the Aroon Indicator
As mentioned before, the Aroon indicator can move in three ways, i.e., bullish, bearish, and ranging. Let us explore all three stages and what it means for the general community:
Bullish and bearish stage. The UP indicator will move from 0 to 100 in a straight line. While this happens, the down algorithm will show an inverse relation moving towards the 0 mark.
Both the up and down indicators can range at the 0, 100, or the in-between mark. These are indicated with the help of zig-zag lines.
A crossover between the up and down indicators can mean that the current trend is changing.
How many days can it take for the market to go from 0 to 100 or vice versa?
The movement of candlesticks governs the mobility of the Aroon indicator. A big red candle can cause the down indicator to reach 100 in seconds. As the time frame controls the candlestick charts, it is possible to say that your intervals will act as a final judgment.
Combining Aroon Indicator with other indicators
As Aroon is used for indicating the momentum, trend, and reversals, we can couple it up with various other indicators in the same class. Using multiple confirmations is a common technique that professionals use to enhance their trading profits.
Moving averages and the Aroon Indicator
Moving averages and Aroon fall in the class of lagging indicators, which may prove inefficient. However, they can be used to determine long-term market trends that can be capitalized on later by jumping into lower timeframes.
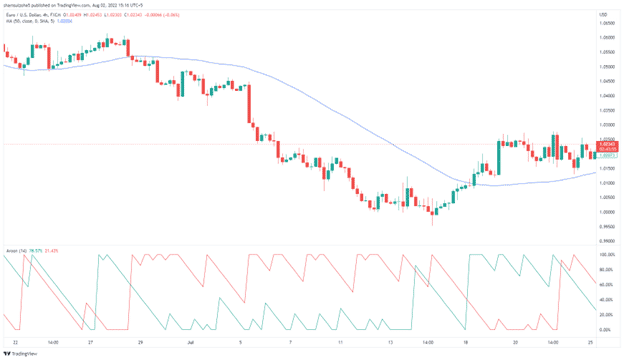
A rising 50 or 200-period moving average with a 14-period up Aroon indicator may highlight an uptrend. The drops in the Aroon with a bullish MA can act as a good point to place a long trade. The opposite condition may hold for a short trade.
Image 2. A sweet example of the 50-period moving average and the Aroon indicator on the H4 chart at EURUSD. The bearish Aroon is painted red, while the bullish is shown with a green line. The red line hangs at around the 100 level, indicating that the bearish trend is strong for now. With a falling 50 period MA, we are ready to take short trades when the down Aroon retraces to the 0 mark.
RSI and the Golden Pocket
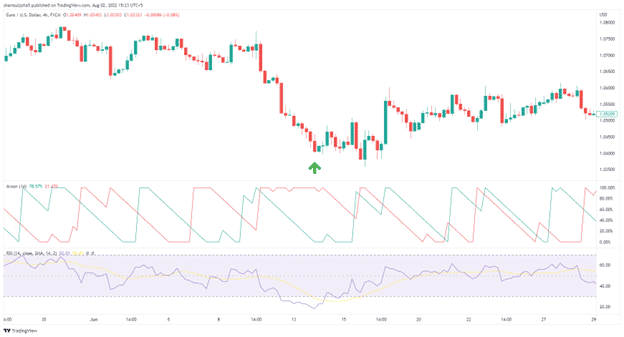
The RSI and the Aroon indicator can act as strongholds for trading reversals. This is possible by determining the overbought/sold conditions on the relative strength index and the spikes from the Aroon.
Holding the 100 mark is hard as any proceeding trend has to vanish due to the force from either buyers’ or sellers’ side. A long horizontal line at 100 may provide some entry in confluence with the RSI.
Image 3. The RSI indicates oversold levels, coupled with a static down line from the Aroon indicator. The sellers close their positions, and the buyers take over, which results in a crossover and a slightly bullish momentum.
Death Cross and the Aroon Indicator
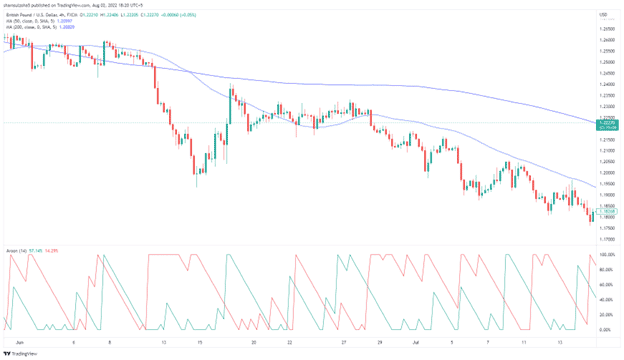
Acting as a major reversal indicator in the stock market, the death cross is a good option for trading trend changes alongside the Aroon. From our previous discussions, we can recall that the crossover between the up and down indicators will highlight a reversal.
There can be many crossovers at Aroon in the same time frame as the death cross. We can jump over to the higher intervals specifically for the Aroon indicator to filter out the noise.
Image 4. The crossover between the 50 and 200 MA is coupled with a downtrend in GBPUSD. The short entries are available when the Aroon indicator reaches the 100 mark with the red line. Can you note how the market is falling steadily?
Donchian Channel and the Aroon Indicator
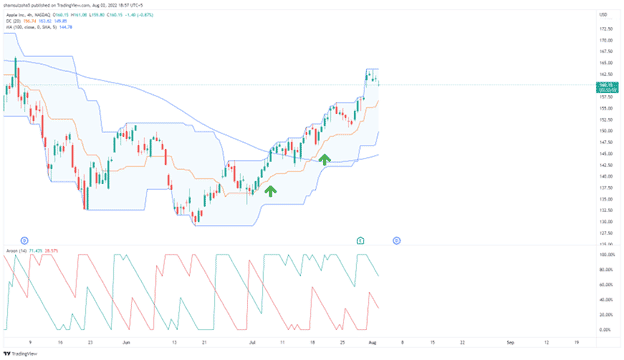
The significance of the Donchian channels lies in measuring the current bullish or bearish bias. As with other indicators, combining this algorithm with other EAs such as the Aroon Indicator is vital for a better outcome. Traders can also add the 100-period moving average to determine the current trend.
A rising price trending within the upper Donchian channel above the 100 MA is the base criteria for setting up a long position. Use the Aroon indicator for the final confirmation. The setting is reversed for a short trade.
Image 5. The 4-hour chart on Apple shows how the Donchian channel, 100 period MA, and the Aroon indicator can work together to produce profitable trades. The green arrows indicate the points where a buy position can be placed, or new executions might be added to the previously held longs.
Candlestick Patterns and the Aroon Indicator
Candlestick patterns are the bread and butter for traders who use technical analysis. A good analysis of candles alone can allow one to determine a suitable entry point, market structure, and reversals. Combine that with the Aroon indicator and get more confluence in your trades.
In fact the Aroon indicator goes hand in hand with the candlesticks. A bullish candle will cause the up Aroon to move towards the 100 mark, while the down Aroon will revert to the zero point. As Aroon is a lagging algorithm, it will only print itself after the current bar is finished.
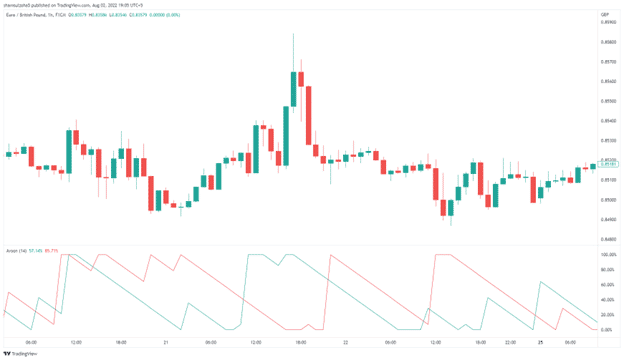
Image 6. The bullish and bearish bars guide the Aroon indicator on the hourly Euro Pound chart. Ranging markets can cause both up and down algorithms to reach zero mark. After the price gains momentum, the lines will head for 100 again.
SAR and the Aroon Indicator
Parabolic SAR is also a trend indicator that may work quite well with the Aroon. It can be a good choice for amateurs as there is no complexity between the two options. The SAR will print dots at the bottom, confirming a buy trade. Head to the Aroon to confirm an uptrend and take the long trade. The stop loss can be placed below the first dot or by using the Fibonacci intervals.
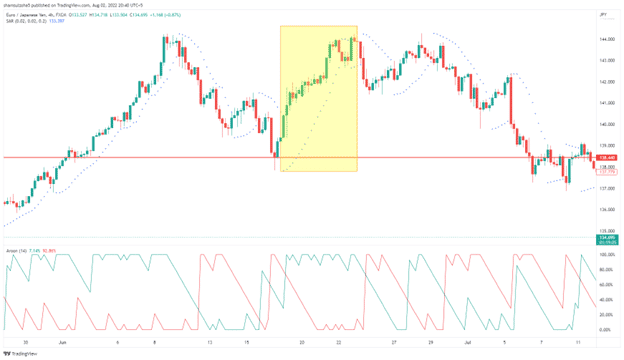
Image 7. The SAR dots and the Aroon indicator print out bullish and negative pictures on the H4 EURJPY chart. The trader can be closed when the SAR prints a dot on the opposing side.
To filter out the noise and receive additional confirmation, traders can also use multiple time frames for their analysis with any indicator. Let us take the case of SAR and the Aroon indicator.
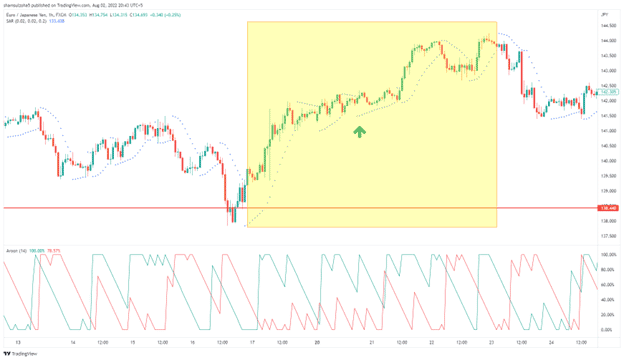
Let us confirm our buy trade on image 8 by diving onto a lower time frame such as the H1 or M15. We expect to place a buy when the SAR and Aroon satisfy all the conditions that were previously mentioned.
Image 8. The SAR dots and the Aroon indicator on the H1 chart are aligned at the green arrow. We receive our buy confirmation and utilize the chance to place our buy trade. While you may miss out on the initial entry point, a delay for further signals would increase the winning probabilities.
Fundamentals and the Aroon Indicator
Fundamentals are responsible for driving the markets in the long term. The Aroon indicator can prove useful if the economic events are tallied with the EA values on the daily or weekly charts.
Aroon Indicator and Other Instruments
While we can use the Aroon indicator on all assets, the profitability can vary between instruments. It is vital to backtest the indicator manually or through your custom trading algorithm.
Managing Risk while Trading Death Cross
The Aroon indicator cannot help you set up a stop loss or take profit on trades. It can only act as a technical tool to help find out reversals or the current market trends. To gauge your risk management, you can again develop custom robots or use a fixed exit point in terms of pips, depending on the instrument.
Some FAQs
What is the winning rate of the Aroon Indicator?
The winning rate of the Aroon Indicator can differ from one instrument to the other. Combining it with other technical tools can help you increase the winning probabilities. Generally, the trade outcome will depend on how well you use the EA.
Can I use Aroon Indicator to pass the prop firm challenge?
Prop firms have strict rules and regulations that require traders to maintain strong discipline. Only use the Aroon indicator after you believe you have a solid strategy that can hold the drawdown.
What trading methods can I use with the Aroon Indicator?
Scalpers, day traders, and swing traders can use the Aroon Indicator. As scalpers are trading on the 1 or 5-minute chart, the outlook of the tool will change accordingly.
Should I trade with Aroon Indicator as a beginner?
Aroon can be a complex indicator to understand for beginners. The up and down lines may confuse the novice community. It might be best to start with a simple option such as a moving average and then proceed over to the Aroon.
Summary
Aroon Indicator is a useful technical indicator that has multiple uses, unlike other tools that are restricted to measuring a single market phenomenon. Beginners should keep in mind that it is not a holy grail indicator and can lose from time to time. A proper mindset will ensure that you can make full use of the EA and maintain long-term consistency.