Assets direction, entry/exit points, and trailing stop loss are not less valuable at the beginning of trade nor less during a trade. The parabolic SAR not only gives you the direction of the assets (by highlighting the possible underway movement), but it also elongates to providing the route of success and securing the profits in a trade.
The parabolic SAR is also referred to as a stop and reverse indicator. The reason is that the parabolic SAR shows the trend direction and possible reversals in price. J. Welles Wilder Jr. developed the indicator to make trading easy and less risky. The parabolic SAR should never be used alone, irrespective of the trade or other concepts actualized during trading. Indicators are not one hundred percent safe from misleading you; thus, engage other indicators to improve your success rate.
As a technical indicator, some of the importance of the parabolic SAR include the trailing stop and reverse method. The “SAR” means “stop and reversal.” The implication applies to the identification of reliable exit and entry points. Several technical indicators identify entry and exit points because the two points are crucial to a trade’s success. Thus, grounded entry and exit points limit loss or other misfortune.
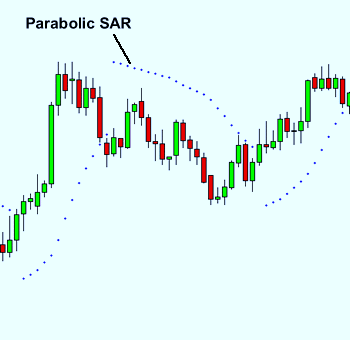
The parabolic SAR connects with price in the form of dots, and the dots are visible as a series on a chart. These dots could be above or below a security’s price, pertaining to the price direction. Price plays an important role in revealing the crucial benefits of parabolic SAR. For example, an uptrend is viable when the dots are below the price, and a downtrend is when the dots are above the price. Many other advantages/uses are listed in this article.
In this article, you shall learn the fundamental of the parabolic SAR and how you can use it, alongside its settings and application to cryptocurrency. Happy reading!
What is parabolic SAR indicator?
The parabolic SAR determines the price direction and changes in the direction. Two crucial things are considered here “direction” and “change in direction.” An asset moves in a specific direction during a change, showing the impact of price on the asset. However, price changes when the asset direction changes. Thus, price is the main tracking factor in determining an asset’s direction and changes. And this is why it is called the “stop and reversal system.”
The indicator appears on a chart as a series of dots: uptrend is viable when the dot is below the price and downtrend when the dot is above the price. The same principle shows a bullish or bearish trend: an uptrend, according to the definition above, is termed a bullish signal, and likewise, a downtrend is termed a bearish signal. A bullish or bearish trend implies that the trend (bullish or bearish) is in control and that the momentum may stay downward (if bearish) and upwards (if bullish).
The parabolic SAR is significant when the dot flips. For example, assuming a trend continues in a bullish trend (that is, the dots stay below the price) and suddenly flips (that is, the dots now stay above the price). Then, a “stop and reversal system” is viable, indicating that a price change is underway. It may indicate a fall in price for this case.
Taking the opposite side, “a bearish trend (that is, the dots stay above the price), and suddenly flips (that is, the dots now stay below the price).” This indicates price rise – as the price rise, the dots increase likewise. However, the dots rise slowly (at first) and then move speedily alongside the accelerating trend. The SAR moves beyond the price: the trend develops with fast-moving SAR such that the dots meet the rising price later.
Lastly, the parabolic SAR indicator is mechanical: active, always changing, and moving. Thus, it gives new signals along short or long. Traders are responsible for figuring out effective trades and those to neglect. For instance, it is advisable to trade short sales during a downtrend, opposing the buy signals or others.
How to calculate parabolic SAR
You can perform the calculation with two parabolic SAR formulas. Check the images below.
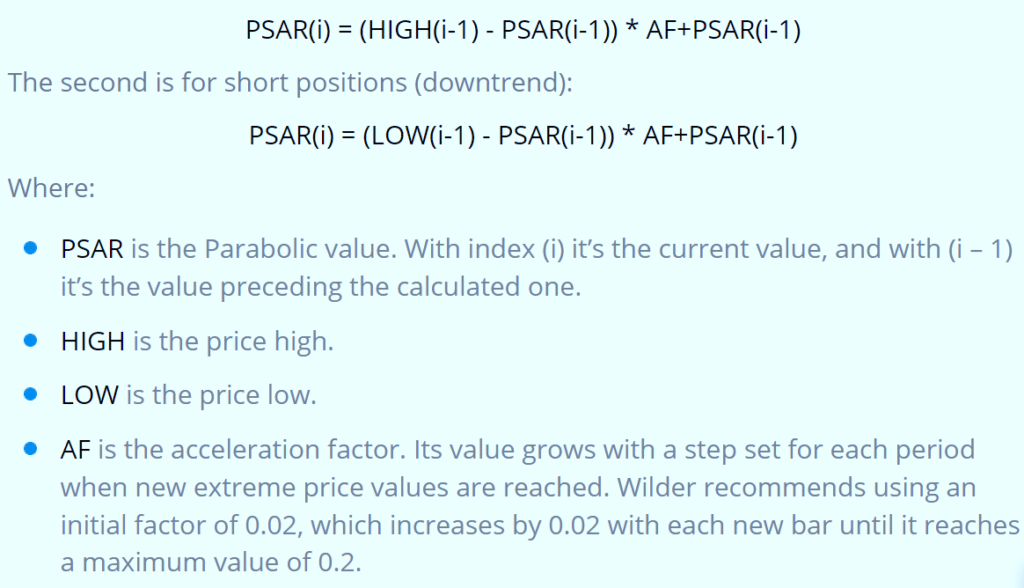
Formula 1
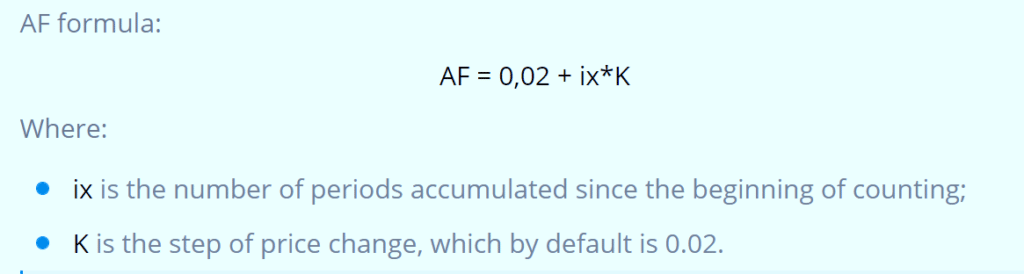
Formula 2
Parabolic SAR success rate
The parabolic SAR success rate according to research by Graduate Student of Finance, University of Houston
In a 17 years study of technical indicators, the parabolic SAR comes up at a 95% confidence level. The research was performed using three technical indicators; researched for 17 years. During the study, the Parabolic SAR is utilized as a stop-loss framework, not really as a trade marker.
For this review, settings for the parabolic SAR were the default 0.02 Step Period and 0.20 Max Step Period. Utilizing this technique, an investor would have exchanged between lengthy or short stances multiple times during the 17 Year study and multiple times during the 5-Year study.
Parabolic SAR returns for when the model was long and short the market for the 17-Year and 5-Year terms:
- parabolic SAR Bullish Return: 375.25%
- parabolic SAR Bearish Return: 303.81%
In summary, the parabolic SAR Long-and-Short Method:
- returned 679.06% in the 17-Year study
- returned 189.91% in the 5-Year study
Investors are constantly encouraged to never utilize the parabolic SAR alone for all intents and purposes; instead, use it with any remaining indicators. Numerous examination methods must be utilized to concoct a total trading framework. You can notice the cost activity or other specialized indicators and fundament investigation.
In view of Wilder, the parabolic SAR works best with moving assets, which generally happens 30% of the time. This implies that the indicator would be inclined to whipsaws for more than half of the time. This can, for the most part, happen when security isn’t moving. Remember that SAR was intended to hop on trend and trail behind it.
The sign quality relies upon the current security settings and properties. The fitting settings blended with fair patterns will create a splendid trading framework – some unacceptable settings will prompt whipsaws and misfortunes.
There isn’t a basic guideline or one-size-fits-all setting for this. All the securities ought to be analyzed in light of their properties. Here is a view of the parabolic SAR settings.
Parabolic SAR settings
The Parabolic SAR setting’s location depends on the platform.
To change the indicator settings, drift your cursor over the chart and snap on the indicator name in the platform’s upper left corner (or right upper corner). This will raise the parabolic SAR settings. Change depends on the situation.
Some settings implications:
- Adding the Acceleration Factor implies the indicator will intently track the price, leaving less room between the indicator and price. This implies more exchange signs and reversals will be recognized.
- Reducing the Acceleration Factor implies a slow-moving indicator and creates a gap between price and indicator. Less reversals happen.
- The Maximum Acceleration works as it were, however, to a lesser degree. The Maximum Acceleration covers how rapidly the indicator can advance quickly during areas of strength for a move. Changes in this setting will have less effect than changing the Acceleration Factor.
Traders who need to enter and leave positions rapidly may pick a higher Acceleration Factor, implying that even little reversals will finish them off a trade.
Longer-term traders that need to stand firm on their footings might reduce the Acceleration Factor. This will bring about the price needs to take greater actions to cause a reversal; hence reversals and trade signs will happen occasionally.
Locating parabolic SAR on MT4 or MT5
Both MT4 and MT5 accompany many specialized indicators, of course – one of which is the parabolic SAR. You can begin trading utilizing the indicator when you download the platform.
You can track down the indicator in MT4 and MT5 by going to the “Navigator” window on the left-hand side of the screen. Here, you will see an envelope named “indicators” and a “trend” subfolder.
When you have double-tapped on the symbol, you will be given a discourse box that permits you to change the Parabolic SAR settings.
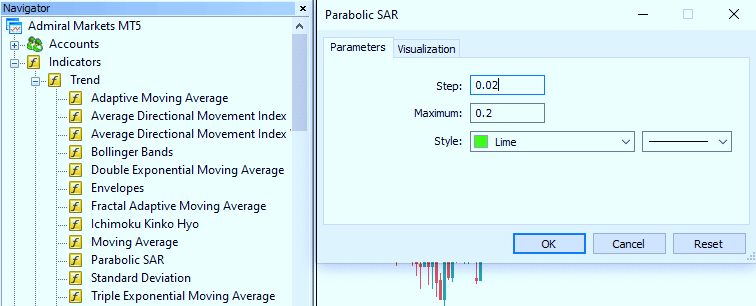
Sadly, there is no right response to this inquiry about “what are the right settings?” It will ultimately rely upon individual factors, such as your way of trading, the time you are trading, and your trading procedure. Through trial and error, you will want to find what parabolic SAR settings are best for you. However, the default values are the best spot to begin.
Wilder showed that the default worth of 0.02 turned out best for him; however, he expressed that anything between 0.018 to 0.021 would function admirably. He suggested not setting the maximum beyond 0.22.
How to use parabolic SAR effectively
Using parabolic SAR as a buy or sell signal
The marker creates trade signals when the place of the dots moves from one side of the resource’s price to the next. For instance, a purchase signal happens when the dots move from over the price to beneath the price, while a sell signal happens when the dots move from underneath the price to over the price.
Using parabolic SAR to trail stop loss
Traders additionally utilize the parabolic SAR dots to set trailing stop loss orders. For instance, if the price is rising, and the parabolic SAR is likewise rising, the parabolic SAR can be utilized as a potential exit if long. Assuming the price dips under the parabolic SAR, leave the long exchange.
The parabolic SAR moves whether or not the price moves. This intends that if the price rises at first yet move sideways, the parabolic SAR will continue to ascend despite the lateral moves in price.
An inversion sign will be created sooner or later, regardless of whether the price hasn’t dropped. The parabolic SAR has to make up for a lost time in the price to create an inversion signal. Thus, an inversion signal on the indicator doesn’t guarantee that the price is switching.
Using parabolic SAR as an active trader
The indicator creates another sign each time it moves to the contrary side of an asset’s price. Generally guarantees a market situation, which makes the indicator interesting to active traders. The indicator works most successfully in moving where huge price moves permit traders to catch critical additions. When a security’s price is range-bound, the indicator will continually switch, bringing about low-benefit or losing exchanges.
Parabolic SAR is best used with other indicators
Traders should utilize the indicator with other specialized indicators effective on a moving market, like the ADX or a trendline. For instance, traders could affirm a parabolic SAR buy signal with an ADX.
Parabolic SAR crypto
Again, the parabolic SAR determines the price direction and changes in the direction. Two crucial things are considered here “direction” and “change in direction.” An asset moves in a specific direction during a change, showing the impact of price on the asset. However, price changes when the asset direction changes. Thus, price is the main tracking factor in determining an asset’s direction and changes. And this is why it is called the “stop and reversal system.” The same price effect is applied to cryptocurrency.
The vital component of parabolic SAR in cryptocurrency is perceiving when the dots get over the price. When this occurs, it is viewed as an indication of reversal and a likely trade signal.
For the basic rule:
- You may sell if the dots are above the price.
- You may buy if the dots are beneath the price.
- The trade is considered neutral during consolidation patterns or sideways action. Even the parabolic SAR shows dots above or below the price action.
Important factors to consider when trading parabolic SAR crypto
Parabolic SAR and false signals
Tragically, the parabolic SAR is not insusceptible to creating misdirecting crypto trade signals. The indicator tends to get over price habitually during times of market consolidation. The rough, hesitant price activity prompts numerous occasional limits being made, compromising the parabolic SAR’s viability.
Nonetheless, it is feasible to diminish the quantity of false buy and sell signals. Some of the most widely recognized ways are to trust that different dots will appear before entering the market or join the parabolic SAR with another specialized device/indicator. Doing so can affirm the importance of a forthcoming reversal, improving the signal certainty.
Basics of Cryptocurrency
The current crypto market mustn’t be overlooked because the parabolic SAR is a stop and reversal pattern. You might be standing firm in the open market for a critical time frame if the parabolic SAR is utilized inside a pattern or reversal setting.
An unexpected spike slows the charts and disturbs parabolic SAR’s capability if persuading news stirs up valuations during a live trade. Should this happen, losses or unusual signals are potential outcomes.
Regardless of the execution of the PSAR, it is essential to assess the crypto market basics as they advance. Make certain to observe when new guidelines are reported.
Risk Vs. Reward
One of the vital advantages of parabolic SAR trading is that it plans to catch benefits from trends and reversal. The benefit targets associated with these are much bigger than rotational procedures when in doubt. The possible productivity is far more noteworthy than from scalps and reversal, while the achievement pace of such exchanges might be negligible. Furthermore, the parabolic SAR is an important device for adjusting risk in live economic situations. Numerous crypto traders utilize the parabolic SAR as a signal to leave open positions. The outcome is a smoothed-out, powerful way to deal with risk.
Read more: