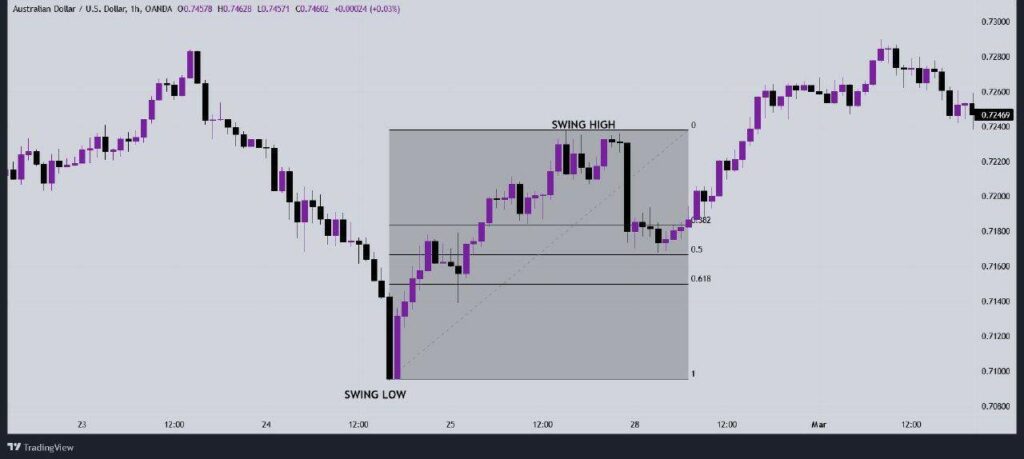
How Does Fibonacci Retracement Work?
The Fibonacci Retracement works by identifying key support and resistance levels based on the Fibonacci sequence. These levels are then used to help traders make decisions about potential entry and exit points. There are several levels that can be identified using the Fibonacci Retracement tool, but the most common levels are 23.6%, 38.2%, 50%, 61.8%, and 100%.
What Do Fibonacci Levels Tell You?
The Fibonacci levels can give you a good idea of where the support and resistance levels are in an asset’s price. They can also help you to identify potential entry and exit points. For example, if you see that the asset’s price is retracing to a Fibonacci level, you might enter a trade at that point in the hope that the price will rebound off of that level.
5 Fibonacci Retracement Mistakes To Avoid At All Times
1. Trying To Use Fibonacci Retracement as A Standalone Tool
One of the most common mistakes made by traders is trying to use Fibonacci Retracement as a standalone tool. The Fibonacci Retracement should not be used alone; it should be used in conjunction with other technical indicators. There are two reasons for this;
Firstly, no technical indicator is 100% accurate. This means that there will be times when the Fibonacci Retracement tool produces false signals.
Secondly, different traders use different Fibonacci levels. This means that what one trader sees as a support level, another trader might see as a resistance level. This is why it’s important to combine the Fibonacci Retracement with other technical indicators; doing so will help to confirm the signals produced by the Fibonacci Retracement tool. An example of this would be to combine the Fibonacci Retracement with candlestick patterns. For example, if you buy when the price retraces to the 61.8% Fibonacci level and there is a bullish engulfing candlestick pattern, this would be considered a confirmation signal.
2. Using Different Reference Points
Another mistake that traders make is using different reference points when drawing the Fibonacci Retracement levels. The reference point is the starting point from which the Fibonacci levels are drawn and it’s important to use the same reference point for all of the levels. The most common reference points are the highest high and lowest low; however, some traders also use the open and close as their reference points. Using different reference points will produce different Fibonacci levels, which can lead to confusion and ultimately result in making inconsistent trades.
3. Incorrectly Identifying Fibonacci Retracement Levels
One of the most common mistakes made by traders is incorrectly identifying Fibonacci Retracement levels. This usually occurs when traders try to use the Fibonacci Retracement tool without first understanding how it works. As we’ve already mentioned, the Fibonacci Retracement is based on the Fibonacci sequence, which is a series of numbers where each subsequent number is the sum of the previous two numbers. The most common Fibonacci levels are 23.6%, 38.2%, 50%, 61.8%, and 100%. Here are two ways to avoid these mistakes.
Firstly, make sure that you understand how the Fibonacci Retracement tool works before using it.
Secondly, use a Fibonacci Retracement calculator or trading platform that will automatically calculate the Fibonacci levels for you. This will help to ensure that you’re correctly identifying the Fibonacci levels.
In addition, you can practice identifying Fibonacci levels on a demo account before live trading.
4. Not Using Stop-Loss Orders
Another mistake made by traders is not using stop-loss orders when trading with Fibonacci Retracement levels. A stop-loss order is an order that is placed to sell an asset when it reaches a certain price; this price is typically below the current market price. Stop-loss orders are important because they help to limit your losses if the market moves against you. For example, let’s say that you enter a long trade at the 61.8% Fibonacci level, but the market starts to move against you and the price falls to the 50% Fibonacci level. If you don’t have a stop-loss order in place, you will continue to hold the trade and hope that the market turns around. However, if you have a stop-loss order in place, your trade will be automatically closed when the price reaches the 50% Fibonacci level, limiting your losses.
5. Not Knowing How To Combine Fibonacci Retracement with Other Indicators
The final mistake that we’ll discuss is not knowing how to properly combine Fibonacci Retracement with other technical indicators. As we’ve already mentioned, it’s important to use the Fibonacci Retracement tool in conjunction with other technical indicators; however, it’s also important to know which indicators to use. Some of the most popular indicators that are used in conjunction with Fibonacci Retracement are candlestick patterns, support and resistance levels, and moving averages.
When combining Fibonacci Retracement with other technical indicators, it’s important to look for confirmation signals. A confirmation signal is simply a signal that indicates that the market is likely to move in the direction you expect it to. For example, if you’re looking for a long trade setup, you might combine the Fibonacci Retracement tool with a bullish candlestick pattern. The bullish candlestick pattern would be considered a confirmation signal and would indicate that the market is likely to move higher.
Confirmations are important because they help to increase the probability of a successful trade. For example, if you’re looking for a long trade setup and you use the Fibonacci Retracement tool without any confirmation signals, there’s a chance that you’ll enter into a losing trade. However, if you use the Fibonacci Retracement tool with confirmation signals, the chances of success are much higher. This is particularly important when trading with Fibonacci Retracement levels because they can be quite precise.
4 Uses Of The Fibonacci Retracement Tool
Now that you know how to avoid the 5 most common mistakes made by traders who use Fibonacci Retracement, let’s discuss 4 uses of the Fibonacci Retracement tool.
1. Identifying Potential Support And Resistance Levels
One of the most popular ways to use Fibonacci Retracement is to identify potential support and resistance levels. As you may know, support and resistance levels are price levels where the market has a tendency to reverse direction. For example, if the market is in an uptrend and it reaches a Fibonacci level, there’s a chance that the market will reverse direction and start moving lower. Similarly, if the market is in a downtrend and it reaches a Fibonacci level, there’s a chance that the market will reverse direction and start moving higher.
2. Identifying Potential Trade Setups
Another popular way to use Fibonacci Retracement is to identify potential trade setups. Fibonacci Retracement levels can be used to identify both long and short trade setups. For example, if the market is in an uptrend and it reaches a 61.8% Fibonacci level, this could be a potential long trade setup. Similarly, if the market is in a downtrend and it reaches a 61.8% Fibonacci level, this could be a potential short trade setup. Many professional traders use Fibonacci Retracement levels to identify potential trade setups because they can be quite accurate.
3. Setting Stop-Loss Orders
Another popular way to use Fibonacci Retracement is to set stop-loss orders. As we’ve already mentioned, stop-loss orders are important because they help you limit your losses if the market moves against you. One of the most popular ways to set stop-loss orders is to use Fibonacci Retracement levels. For example, if you’re looking for a long trade setup, you might set your stop-loss order just below the 61.8% Fibonacci level. Similarly, if you’re looking for a short trade setup, you might set your stop-loss order just above the 61.8% Fibonacci level.
4. Taking Profit At Key Fibonacci Levels
Another popular way to use Fibonacci Retracement is to take profit at key Fibonacci levels. For example, many traders will take profit on a long trade when the market reaches the 61.8% Fibonacci level. Similarly, many traders will take profit on a short trade when the market reaches the 61.8% Fibonacci level. While there’s no guarantee that the market will reverse direction when it reaches these key Fibonacci levels, they’re often good levels to take profit at because the market has a tendency to reverse direction around them.
4 Factors To Consider Before Using Fibonacci Retracement
Before using Fibonacci Retracement, there are 4 factors that you need to consider.
1. The Time Frame Of The Chart
One of the most important factors to consider before using Fibonacci Retracement is the time frame of the chart. This is because Fibonacci Retracement levels can be different on different time frames. For example, the 61.8% Fibonacci level on a daily chart is not the same as the 61.8% Fibonacci level on a 1-hour chart. As such, it’s important to make sure that you’re using Fibonacci Retracement levels in the correct time frame. Of course, whichever time frame you choose depends on your trading style and preferences.
2. The Trend Of The Market
Another important factor to consider before using Fibonacci Retracement is the trend of the market. This is because Fibonacci Retracement works best in trending markets. For example, if the market is in an uptrend, you would look for long trade setups using Fibonacci Retracement levels. Similarly, if the market is in a downtrend, you would look for short trade setups using Fibonacci Retracement levels. So, before using this tool, you should determine the dominant market trend in the time frame you are trading. Furthermore, you should make sure that the market is indeed trending. This can be done by using trend-following indicators such as the moving averages.
3. The Volume Of The Market
Another important factor to consider before using Fibonacci Retracement is the volume of the market. This is because Fibonacci Retracement works best in markets with high volumes. For example, if you’re trading on a 1-hour chart, you would look for times when the market has high volume. Similarly, if you’re trading on a daily chart, you would look for days when the market has high volume. Of course, this isn’t always possible and there will be times when you have to trade in low-volume markets. However, if you can trade in high-volume markets, it would be ideal.
4. The Support And Resistance Levels Of The Market
The last factor to consider before using Fibonacci Retracement is the support and resistance levels of the market. This is because Fibonacci Retracement can be used to identify potential support and resistance levels. For example, if you see that the market has reversed at the 61.8% Fibonacci level on multiple occasions, you can expect this level to act as a potential support or resistance level in the future. As such, you should consider this when placing your trade orders.
FAQs about Fibonacci Retracement
1. What Is Fibonacci Retracement?
Fibonacci Retracement is a technical analysis tool that is used to identify potential support and resistance levels. It is based on the Fibonacci Sequence, which is a series of numbers that are derived from each other by adding the previous two numbers together.
2. How Does Fibonacci Retracement Work?
Fibonacci Retracement works by identifying potential support and resistance levels based on the Fibonacci Sequence. These levels are typically referred to as Fibonacci Levels.
3. What Are Fibonacci Levels?
Fibonacci Levels are nothing more than potential support and resistance levels that are derived from the Fibonacci Sequence. The most popular Fibonacci Levels are the 61.8% level, the 38.2% level, and the 23.6% level.
Read more: