The trend strength shows the tendency of a trade success or failure. Traders often ask, “what would be the fate of trade based on these results/research? Trading is fun and easy to approach, especially if you know and understand some conditions. For example, you may potentially predict the future of a trade because of the present values you analyzed, and they may come true. By doing this, you have successfully traded virtually before embarking on the real journey.
All traders must trade before they hit the market and make it work: “mind trading” is synonymous with the average directional movement index. You have analyzed the possible trade outcome via the technical analysis indicator: average directional movement index. Now, you have learned that the ADX shows some possible outcomes of a trade even before you embark on it. Thus, what is the average directional movement index, and how can you calculate it?
This article discusses the ADX and how you can apply it in Forex trading; it further explains the formula and settings. Read more and learn the ADX indicator for day trading and other trades.
What is the Average Directional Movement Index?
The average directional movement index indicates a trend’s strength and direction; the trend tells traders what to do. For example, a positive sign may indicate a move in a certain direction (based on trend); however, the strength shows the intensity of the move. In other words, the average directional movement index tells you how important a trend is.
Yes, you can interpret a trend and apply it in your trade; notwithstanding, ADX does not teach you about trends; it teaches “trend strength:” how important the trend is and its implication.
The average directional movement is estimated over a period during which the average price’s (range of security) expansion or contraction is figured using a trend. The trend strength is organized in a trading system formed by Welles Wilder.
Wilder organized ADX similarly to a graph with (a horizontal and vertical axis) – that is, ADX is best explained using directions: The Plus Directional Indicator (+DI) and Minus Directional Indicator (-DI). The directional indicators are applicable in commodities, daily prices, and stocks.
Wilder created the directional indicators from his analysis using “two consecutive highs and lows.” He located the differences in highs and related them to lows. Thus, building the backbone of ADX as a negative and positive directional movement. The two indicators (plus directional indicator and minus directional indicator)are termed “Directional Movement Indicator (DMI), and they locate the trend direction over time.
However, the Directional Movement Indicator (DMI) only discusses the trend direction. The average directional index is not complete without strength. Simply put, the Directional Movement Indicator (DMI) shows the trend direction, but the differencebetween the Directional Movement Indicator (DMI) shows the trend strength.
Mathematically,
- Directional Movement Indicator (DMI) = plus directional indicator (+DI) and minus directional indicator (-DI) = trend direction.
- Difference of Directional Movement Indicator (DMI) = (+DI) – (-DI) = trend strength.
The Average Directional Index (ADX) is further defined as the differences between the (+DI) and (-DI). ADX measures the trend strength over time and regardless of direction. Furthermore, you can call the ADX the trend strength!
What does the Average Direction Index (ADX) tell you?
The only difference between the ADX and DMI is that ADX determines the trend strength while the DMI determines the direction. Recall that the ADX is the Average Directional Index, the difference between (+DI) and (-DI). On the other hand, the DMI determines the trend direction: the plus directional indicator (+DI) and minus directional indicator (-DI).
ADX signals trend strength, which could be strong or weak. A strong strength is characterized when the ADX is above 25, and a weak strength when the ADX is below 20.
The ADX further explains crossovers: indicating when to buy, short trade, exit, or enter a trade. For example, a trade signal with +DI and -DI lines cross with ADX above 20 or (ideally above) 25, indicating a chance to buy. Conversely, a trade signal with -DI and +DI lines cross with ADX above 20 or 25, indicating a chance to short trade.
Crossovers also signal when to enter or exit a trade. For example, it is advisable to enter a trade when a trade signal shows ADX < 20. Conversely, you may exit a trade when a trade signal shows -DI crosses above the +DI.
Positive Directional Indicator
The Positive Directional Indicator (+DI) is a part of the Average Directional Index (ADX) and is utilized to quantify the presence of an uptrend. When the +DI is inclining up, it is a sign that the uptrend is getting more grounded.
- This pointer is almost consistently plotted alongside the Negative Directional Indicator (- DI).
- Uptrend reinforces when the Positive Directional Indicator (+DI) goes up and beyond the Negative Directional Indicator (-DI).
- Downtrend reinforces when the +DI drops down and beneath the -DI.
- Crossovers observed at the +DI and -DI demonstrates the chance of a recent trend arising.
The +DI indicator covers little. It is joined with the Negative Directional Indicator (- DI) to offer some incentive. Along these lines, investors can check which direction has more power and spot crossovers that might show recent trends.
A third line, called the ADX, is likewise frequently added. This line shows pattern strength by taking a normal contrast among +DI and -DI.
Indeed, even with these extra lines, +DI can, in any case, deliver flawed signals. Crossovers might happen without a pattern in price. Additionally, the indicator is taking a gander at a verifiable price and isn’t prescient of where prices will go straightaway.
Negative Directional Indicator
The Negative Directional Indicator (+DI) is a part of the Average Directional Index (ADX) and is utilized to quantify the presence of a downtrend. When the -DI is sloping up, it is a sign that the downtrend is getting more grounded.
- This pointer is almost consistently plotted alongside the Positive Directional Indicator (- DI).
- A downtrend reinforces when the Negative Directional Indicator (-DI) goes up and beyond the Positive Directional Indicator (+DI).
- A downtrend reinforces when the -DI drops down and beneath the +DI.
- Crossovers observed at the +DI and -DI demonstrates the chance of a recent trend arising: a new trend may be coming if the -DI crosses above the +DI
The -DI indicator covers little. It is joined with the Positive Directional Indicator (+DI) to offer some incentives. Along these lines, investors can check which direction has more power and spot crossovers that might show recent trends
A third line, called the ADX, is likewise frequently added. This line shows pattern strength by taking a normal contrast among -DI and +DI – this can bring about whipsaws.
Average Directional Movement Index Forex
The same principle of ADX applies to Forex and others. Using the ADX indicator for Forex trading requires us to walk through the previously explained ADX properties.
If you take 25 as the reference point: values below 25 show a weak trend, and above 25 show strong strength. You can also have a strong and extremely strong trend based on value, unlike the values explained above, that is, 25. The value may extend to 40 or more in Forex trading. Values above 40 are named strong and extremely strong if it is above 50.
Using the three indicators </> 25, 40, or 50 on a graph plot gives the trend direction and strength simultaneously, referred to as gauging the strength. Traders figure the strength by checking the ADX value according to the reference. The trend movement and strength should reflect the price chart using the indicators.
The advantages of involving the ADX in Forex
+DI, and – DI to decide pattern strength and movement. First, the ADX furnishes investors with a more exact entry and exit focus. At the point when the ADX moves over 25 and keeps on rising, numerous dealers view it as an encouragement to enter an exchange.
Any ADX readings under 25 show that the pattern finishes and act as the last exit point. Entering and leaving the trade near the 25 lines will have less potential benefit if the pattern starts to shape or is consistently debilitating. Hence, a few investors utilize a higher measure, for example, 40, as their trade entry and exit since ADX developments over 40 demonstrate more grounded strength and the best benefit potential.
However, a pattern might go on in a similar heading as the ADX falls between 40 and 25; the cost will unite as the pattern strength decreases, consequently lessening the trader’s potential net revenue. Therefore, looking at ADX heights and dips can give traders a feeling of market movement.
Average Directional Movement Formula
How to use the formula
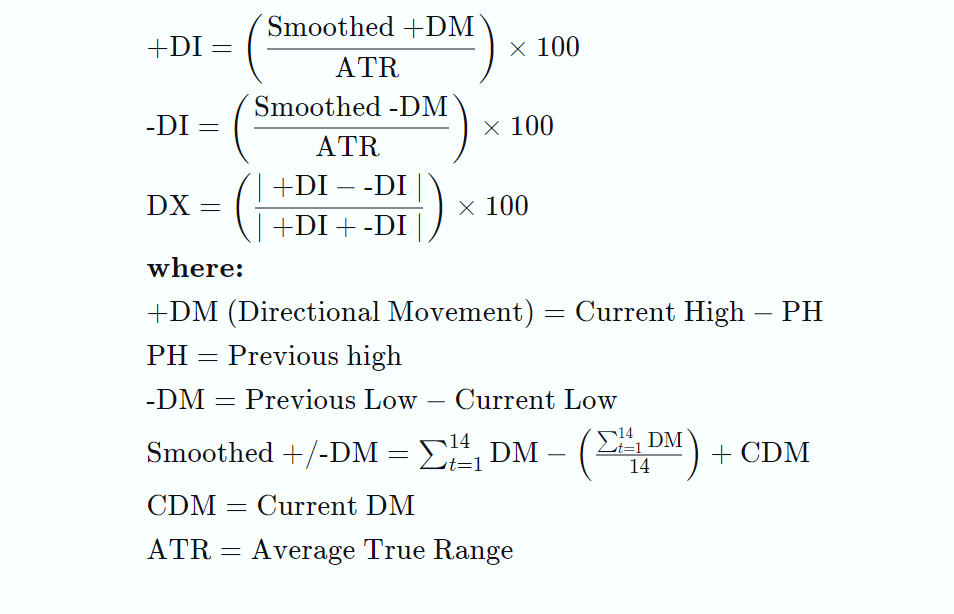
- There are about 14 periods: calculate the true range (TR), -DM, and +DM for each period.
- -DM = previous low – current low.
- +DM = current high – previous high.
- Use +DM when the summation of (previous low – current low) > (current high – previous high).
- Use -DM when the summation of (current high – previous high) > (previous low – current low).
- The true range TR is > of the current low – previous close, the current high – previous close, or the current high – current low.
- Smooth the 14-period averages of +DM, -DM, and the TR.
- First 14TR = sum of first 14 TR readings.
- Next 14TR value = First 14TR – (Prior 14TR/14) + Current TR
- Next, divide the smoothed +DM value by the smoothed average true range (ATR) value to get +DI. Multiply by 100.
- Divide the smoothed -DM value by the smoothed TR value to get -DI. Multiply by 100.
- The optional directional index (DX) is +DI minus -DI, divided by the sum of +DI and -DI (all absolute values). Multiply by 100.
Positive Directional Movement Formula
How to use the formula
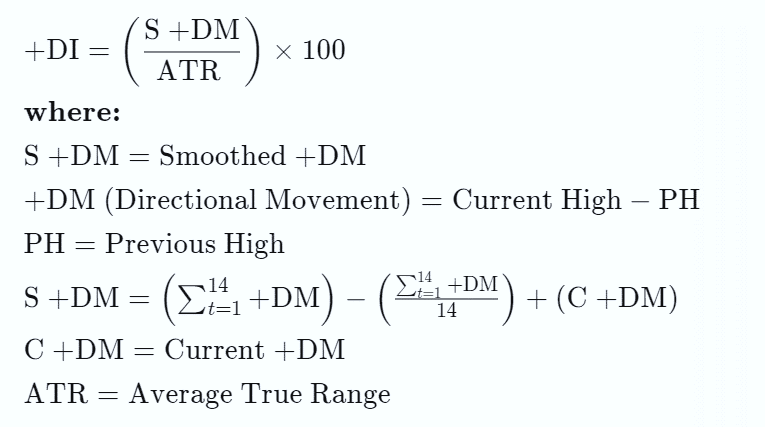
- Find +DM and True Range (TR) to get the value of +DI
- +DM = Current High – Previous High.
- A period with a value (Current High – Previous High > Previous Low – Current Low) is counted as a +DM. Use -DM when (Previous Low – Current Low > Current High – Previous High).
- The True Range (TR) is > of the Current Low – Previous Close, The Current High – Previous Close, Or the Current High – Current Low.
- Smooth the 14 periods of +DM and TR; change TR for +DM to calculate ATR.
- First 14-period +DM = Sum of first 14 +DM readings.
- Next 14-period +DM value = First 14 +DM value – (Prior 14 DM/14) + Current +DM
- Divide the smoothed +DM value by the ATR value to get +DI. Multiply by 100.
Negative Directional Movement Formula
How to use the formula
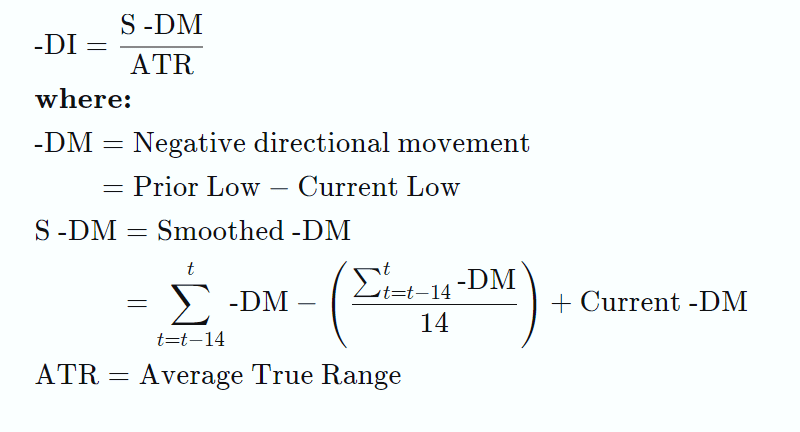
- Find -DM and True Range (TR) to get the value of -DI
- -DM = Previous Low – Current Low.
- A period with a value (Previous Low – Current Low > Current High – Previous High) is counted as a -DM. Use +DM when (Current High – Previous High > Previous Low – Current Low).
- The True Range (TR) is > of the Current Low – Previous Close, The Current High – Previous Close, Or the Current High – Current Low.
- Smooth the 14 periods of -DM and TR; change TR for -DM to calculate ATR.
- First 14-period -DM = sum of first 14 -DM readings.
- Next 14-period -DM value = First 14 -DM value – (Prior 14 DM/14) + Current -DM
- Divide the smoothed -DM value by the ATR value to get -DI. Multiply by 100.
ADX Indicator Settings
Traders barely use the ADX indicator alone as it is not a self-guarantee assurance of trade. Thus, it is best used with other indicators like support and resistance levels, moving averages, trend indicators, or other price movement indicators. For example, ADX with trend indicators gives more objective validity and direction of a breakout over a range.
The conventional setting for the ADX indicator is 14-time spans. However, experts have generally involved the ADX with settings as low as 7 or as high as 30. Higher settings limit misleading signs yet make the typical ADX a seriously less qualified indicator.
Every one of the essential calculations is complex. Luckily, there’s a compelling reason not to do them yourself because there are computerized values already. You should apply the ADX to a graph, with every one of the essential estimations accomplished for you, as indicated in your time frame.
ADX values assist traders with distinguishing the most grounded and beneficial patterns to exchange. The qualities are likewise significant for recognizing moving and non-moving circumstances. Numerous traders will utilize ADX readings over 25 to recommend that the pattern is sufficient for pattern exchanging procedures. Then again, when ADX is under 25, many will stay away from trend-trading strategies.
Low ADX is normally an indication of accumulation or distribution. At the point when ADX is under 25 for more than 30 bars, cost enters range conditions, and cost designs are frequently simpler to recognize. At that point, the cost goes all over among resistance and support to track down buying and selling interest separately.
How to use ADX indicator for day trading
Let us “follow the trend!” ADX indicator allows you to identify the strength of the trend you need to follow. Your basic trading knowledge increases profit-making chances if you follow the trend.
Day trading is the trading of offers on a day. One of the most incredible day trading tips is to concentrate on the trends and afterward trade appropriately; the ADX indicator is one of the most amazing assistance.
Very much like the trading time is unique, the ADX indicator additionally must be set appropriately for day trading. When it is about day trading, more limited time spans work better. ADX indicator is a pattern strength indicator. This implies that when the worth of the ADX indicator rises, the continuous trend (bullish or bearish) is reinforcing and will go like something very similar for quite a while
When the ADX begins falling, we can say the pattern has likewise begun debilitating. As a general rule, the ADX indicator, as a matter of course, goes from 0-100. Each ADX indicator says a ton regarding the strength of the indicator and makes it more straightforward for the merchant to settle on a trade choice.
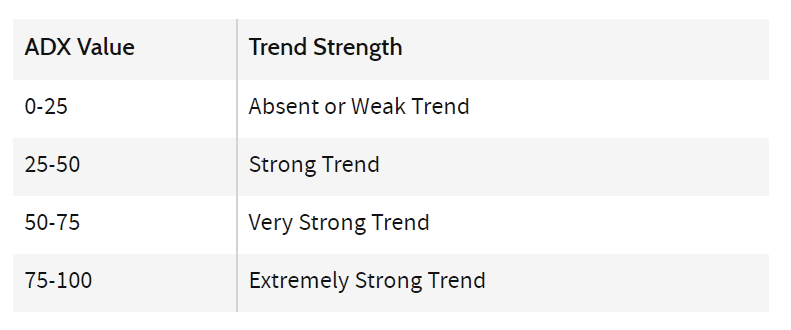
We should perceive how different worth of the ADX indicator assumes an alternate part:
- 0-25. When the ADX indicator is low, anyplace between the scope of 0-25 shows that the market is moving sideways.
- Over 25. If the ADX strength moves over 25, it demonstrates major areas of strength. So if you see a bullish pattern, the strain on the buyer will remain, and assuming the market is bearish, the seller will rule.
Likewise, note that the falling of the ADX indicator is certainly not a sign of a pattern inversion; it shows that the pattern has begun debilitating.
Read more: