All pattern trading has uniqueness; one does not overpower the other, especially if you know how valuable each pattern is. We shall discuss the importance of diamond pattern trading and why you should be familiar with it as a trader.
The diamond pattern is one of the best trading patterns suitable for trading and detecting reversals. Prediction is “the heartbeat” of a good trade: diamond pattern allows you to predict reversals easily.
Reversal trading strategy is not new to experienced traders: it is the change in the asset price movement. For example, how could you predict that the current asset price would change in trend before reality? No one knows the future, but diamond pattern trading allows you to predict the future of reversals.
Trendlines and trading channels are the main deal of reversal trading, which diamond pattern analyses perfectly. Long-term investors and day traders use the diamond pattern for self-gains because it improves the opportunity to maneuver the market for maximized profit.
What is diamond pattern?
As you have learned, diamond pattern detects reversals and potentially increases profits if the pattern is correctly predicted. Diamond patterns detect bullish or bearish, which are classified based on the movement: reversal with uptrend signifies bearish diamond formation (or diamond top), and reversal with downtrend signifies the bullish diamond formation (or diamond bottom).
The diamond shape comes from long-term trending and flattening sideways movements. The odds of success is best maximized when traders combine diamond pattern, technical indicators, and research analysis.
The diamond pattern is one of the technical indicators that cannot guarantee success alone: it is best when combined with other technical approaches. For example, assuming diamond pattern indicates a downtrend, you may combine diamond pattern with another technical indicator to analyze a trend if it goes up or down.
Diamond pattern trading formation
A typical diamond connects the top and bottom crystals, giving the diamond shape. The same configuration occurs in a diamond pattern; however, there are support lines and resistance levels instead of diamond crystals.
The support lines and resistance levels form below and above, connecting the recent lows and highs. In short, a diamond pattern contains the most recent highs and lows, the support lines, and resistance levels.
Price fluctuation comes first as widened characters and later narrows across the pattern. There is a need for a price oscillator since price fluctuation happens. You can increase accuracy with the price oscillator because you have closely monitored the relative strength index, average convergence, and divergence. Monitoring is important to gauge price action movement and analyses/confirm the break of resistance or support.
The diamond pattern is widely effective in long-term investment, linked to the bullish diamond bottom. Traders based their research on this and (may) neglect the bearish diamond top because of its infrequency. However, bearish diamond provides opportunities for short-term traders. Let’s talk about the reversal trading with the diamond pattern before discussing bullish and bearish diamonds.
Reversal trading strategy with diamond pattern
Recall that reversal is the change in a price direction, from going up to going down, or vice versa. The best way to make reversal trading is to get out of the way before it happens, or traders make the best of the change in price direction. The diamond pattern is one of the patterns that detect reversal underway.
Pullbacks or consolidations popularly occur if there are small counter-moves against the trend. Reversal is thus referring to large price changes towards the trend change in direction. Reversals and breakouts are comparable; thus, indicators like an oscillator, channel, or moving average are best used to distinguish the movements.
At first, reversals look like a pullback when it occurs. However, pullback ends, and then the price changes and moves back in the trend direction, unlike reversal (it goes and later forms a new trend).
Applying a reversal trading strategy
Reversal count in long-term and short-term trading may occur quickly or over days, weeks, and years. You may place reversal based on daily or weekly charts, as the case may be. The important thing is that reversal is time-bound and the time pertaining to a trader differs from others. A trader watching reversal on a minute chart differs from weekly or daily charts. For example, a five-minute reversal is crucial to day traders; however, it is irrelevant to a long-term investor.
Reversal with uptrend means that there are collections of higher lows and swing highs; it reverses into a downtrend by transforming collections of lower lows and swing lows. Conversely, reversal with downtrend means that there are collections of lower highs and lower lows; it reverses into an uptrend by transforming collections of higher highs and higher lows.
Example of reversal trading
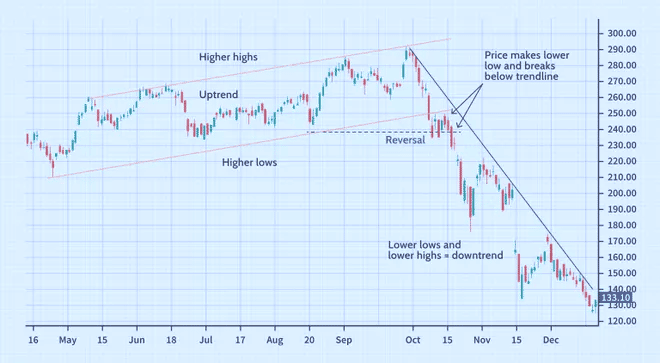
Consider the chart above; it shows an uptrend moving with a channel, generally making better upsides and more promising low points. The cost first breaks out of the channel and beneath the trendline, flagging a potential pattern change – the cost then lowers, dipping under the earlier low inside the channel. This further affirms the presence of reversal.
The cost then, at that point, proceeds with lower, making lower lows and lower highs. An upside reversal will not happen until the cost makes a higher high and higher low. However, a move over the plunging trendline could give an early admonition indication of a reversal.
Alluding to the rising channel, the model additionally features the subjectivity of trend examination and reversals. A few times inside the channel, the cost makes a lower low compared to an earlier swing, yet the general direction stayed up.
Reversals and trends
Trends and reversals provide subsequent trading information that all traders need to profit in the market. One way traders quantify this is through options like diamond pattern trading. Up and down trends majorly identify trends; however, these concepts are not the only techniques used to confirm the trends.
Breakout gaps followed by runaway gaps are the two main identifiers of trends: trends begin with breakout gaps and runaway gaps.
Diamond top pattern (bearish diamond)
The diamond top pattern looks like a head and shoulders formation. As we have mentioned earlier, the diamond top represents a bearish move, a collection of up-and-down price fluctuations. There are two sections of trendline in bearish diamond: upper and lower.
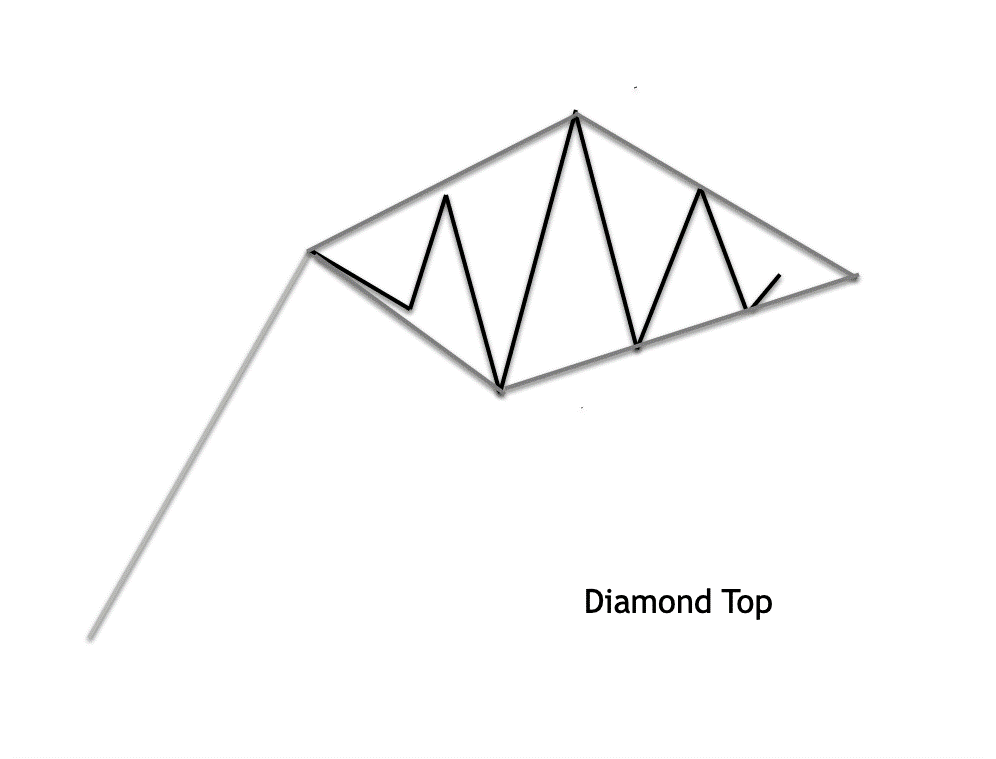
The upper section contains the first trendline, which occurs from the connection between the head and left shoulder; the second trendline occurs from the connection between the head and right shoulder.
The lower section includes the swing lows and troughs: the combination of the two forms the V shape.
The diamond top pattern comes into play by combining the first trendline with the second trendline and the swing lows with the troughs.
The diamond top pattern’s market goes to a high point and continues to the lower. It means the market makes a higher high: the market price later reduces, going below the initial swing low and making a new swing low point. The variation continues, and the peak comes into play when prices increase. The price action moves lower (without eliminating the initial swing low point).
Prices move higher again; it goes below the peak point reached initially. Lastly, the price falls again and remains above the initial swing low point this time. Four barely equal-sized trendlines and swing lows connect at the structure’s top and bottom upon complete circulation, respectively. Again, this is where the pattern comes into play – DIAMOND PATTERN.
Although the “diamond pattern” does not always give the shapes at the top and bottom. However, this does not nullify the meaning of the “diamond top pattern and interpretation.”
Using the diamond top pattern
A typical diamond top pattern will give you important options for certain values. For example, you may locate the breakout entry signal, target level, short entry signal, and other important values.
Assuming you want to locate the entry point with a diamond top pattern – pick your entry point from the breakout below the lower right-hand line. However, some traders take it at the break and close below this line sloping upward.
You can calculate the price target with the measured move technique.
The measured move technique corrects the initial trend and serves as a continuation to the newly formed impulse. The primary wave of the measured move design goes about as an inversion to the latest. After the primary wave creates, a subsequent wave goes about as a remedy or a combination of the principal wave. Then, at that point, after the subsequent wave is done, a third wave structures on the graph. The third wave is the one we sit tight for to start our position. The third wave will continue toward the principal wave, and the objective for the third wave is equivalent to the length of the main wave.
The diamond top pattern trading strategy rules
- An unmistakable uptrend should be set up preceding the diamond top.
- The diamond top ought to be characterized by four trendlines that associate with one another and are moderately close to each other.
- Enter a sell order at the market at break/close beneath the vertical inclining trendline close to the end of the pattern.
- The target level will be determined in view of a deliberate move calculation.
- The stoploss should be put at the latest swing high before the breakout point.
- An extra time stop component will be on the trade.
Diamond bottom pattern (bullish diamond)
The diamond bottom pattern looks like an inverted head and shoulders formation. As we have mentioned earlier, the diamond bottom represents a bullish move, a collection of (inverted) up-and-down price fluctuations. There are two sections of trendline in the bullish diamond pattern: upper and lower.
The upper section contains the first trendline, which occurs from the connection between the (inverted) head and left shoulder; the second trendline occurs between the (inverted) head and right shoulder.
The lower section includes the swing points: the combination of the two forms the V shape.
The diamond bottom pattern comes into play by combining the first trendline with the second trendline and the swing points.
Again, the “diamond pattern” does not always give the shapes at the top and bottom. However, this does not nullify the meaning of the diamond top pattern and interpretation.
Using the diamond bottom pattern
A typical diamond bottom pattern includes a downward price move, characterized by two lower upward and downward trendlines. For example, you may locate the breakout entry signal, target level, long entry signal, and other important values.
Assuming you want to locate the long entry point with a diamond bottom pattern. You may pick your entry point from the breakout above the upper right-hand power line sloping downward. However, it is best to wait for the actual breakout/close and take it at the break and close above this trendline. The reason is to avoid false signals and whipsawing price action.
You can calculate the upper price target by calculating the high to low within the structure. Calculating the high and low requires a process: calculate the distance, plot on the chart, and elongate the distance between the breakout point and the target level. Then, exit the whole position (or a large percentage) when the price reaches the target level. However, you may open a small percentage if need be.
The diamond bottom pattern trading strategy rules
- An unmistakable downtrend should be set up preceding the diamond bottom.
- The diamond bottom ought to be characterized by four trendlines that associate with one another and are moderately close to each other.
- Enter a buy order at the market at break/close above the sloping trendline close to the end of the pattern.
- The target level will be determined given a deliberate move calculation.
- The stoploss should be at the latest swing low before the breakout point.
- An extra time stop component will be on the trade.
Read more: