What Is A Wedge Pattern?
A wedge pattern is a technical analysis tool that’s used to predict reversals in the market. It’s called a wedge because it looks like one on a chart. There are two types of wedge patterns: rising and falling.
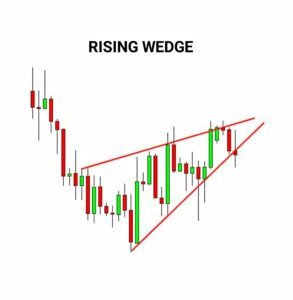
Rising wedges occur when the market is trending upwards. It is characterized by two ascending trendlines that slowly converge as the market trades higher.
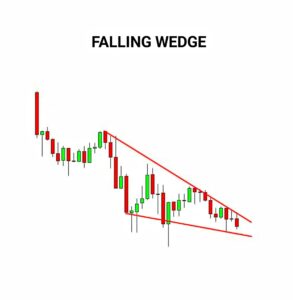
Falling wedges happen when the market is trending downwards. They are characterized by two descending trendlines that slowly converge as the market trends downward. Both types of wedges are considered to be continuation patterns, which means they usually occur in the middle of a trend.
How To Identify A Wedge Pattern
There are four factors you need to consider before you can identify a wedge pattern on a chart:
1 The Market Should Be In a Trend
Wedge patterns only occur in the middle of a trend, so the first thing you need to check is whether the market is indeed trending. You can do this by looking at the longer-term charts to see if there’s a clear direction.
2 There Should Be Two Reversals
For a wedge pattern to be valid, there should be two reversals. These are usually marked by peaks and troughs on the price chart.
3 The Reversals Should Be Getting Narrower
When you plot the reversals on a chart, you should see that they’re getting closer together. This narrowing is what creates the wedge shape.
4 There Should Be Volume Decline
As the pattern forms, you should also see volume start to decline. This is because fewer and fewer traders are participating in the market as the trend starts to reverse.
How To Trade A Wedge Pattern
Once you’ve identified a wedge pattern, you can start thinking about how to trade it. There are two main ways to trade wedges: breakout and reversal.
Breakout trading involves taking a position at the point where the price breaks out of the wedge pattern. This can be either at the top or bottom of the pattern, depending on which direction the market is moving in. The idea behind breakout trading is that the market will continue in the same direction once it breaks out of the pattern.
Reversal trading, on the other hand, involves taking a position when the price reverses at the end of the wedge pattern. This usually happens after a period of consolidation, and can be a good way to get in on a trend early.
Tips For Success When Trading Wedges Patterns
Here are some top tips to help you succeed when trading wedge patterns:
1. Look For A Clear Trend Before Getting Involved
As we mentioned before, wedge patterns only occur in the middle of a trend. So, before you start looking for wedges to trade, make sure that there’s a clear trend in place. Otherwise, you could end up taking a losing trade.
2. Use Volume To Confirm The Pattern
Once you’ve found a wedge pattern, check the volume to make sure it’s declining. If it isn’t, then there’s a good chance that the pattern isn’t valid and you shouldn’t take the trade.
3. Be Patient And Wait For A Breakout
If you’re planning on trading the breakout of a wedge pattern, it’s important to be patient and wait for a clear break out before getting involved. Jumping in too early could mean buying or selling before the trend has really started, which could lead to losses.
4. Place Your Stops Carefully
When trading any kind of reversal pattern, it’s important to place your stop-loss orders carefully. If you’re trading a breakout, you should put your stop below the lows of the pattern. And if you’re reversal trading, you should put your stop above the highs of the pattern.
5. Take Profit When The Price Reaches The Trendline
Once you’re in a trade, you can take profit when the price reaches the trendline that marks the end of the wedge pattern. This usually happens before the price reaches the top or bottom of the pattern, so it’s a good way to lock in some profits early.
Indicators To Combine With The Wedge Pattern
There are a few indicators that can be used to confirm wedge patterns and help you make better trading decisions.
1. Moving Averages
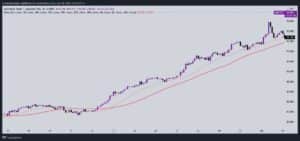
Moving averages are a popular technical indicator that can be used to confirm wedge patterns. If the market is in a downtrend, you should look for a bearish wedge pattern to form below the moving average. And if the market is in an uptrend, you should look for a bullish wedge pattern to form above the moving average. Another way to use moving averages is to wait for the price to break out of the pattern and then cross back above or below the moving average. This can be a good way to confirm that the breakout is real.
2. Relative Strength Index (RSI)
The relative strength index (RSI) is another popular technical indicator that can be used in conjunction with wedge patterns. If the market is in a downtrend, you should look for a bearish wedge pattern to form below the 30 level on the RSI. And if the market is in an uptrend, you should look for a bullish wedge pattern to form above the 70 level on the RSI. This combination can be a good way to confirm that the pattern is valid and the market is likely to continue in the same direction.
3. Stochastic Oscillator
The stochastic oscillator is a momentum indicator that can be used to confirm wedge patterns. If the market is in a downtrend, you should look for a bearish wedge pattern to form below the 20 level on the stochastic oscillator. And if the market is in an uptrend, you should look for a bullish wedge pattern to form above the 80 level on the stochastic oscillator. This combination can be a good way to confirm that the pattern is valid and the market is likely to continue in the same direction.
4 Bollinger Bands
Bollinger bands are indicators that work by measuring market volatility. They can be used to confirm wedge patterns by looking for a pattern to form outside of the Bollinger bands. If the market is in a downtrend, you should look for a bearish wedge pattern to form below the lower Bollinger band. And if the market is in an uptrend, you should look for a bullish wedge pattern to form above the upper Bollinger band. This combination can be a good way to confirm that the pattern is valid and the market is likely to continue in the same direction.
5 MACD
The moving average convergence divergence (MACD) indicator can also be used to confirm wedge patterns. While using this indicator, you should look for a bearish wedge pattern to form below the MACD line if the market is in a downtrend. And if the market is in an uptrend, you should look for a bullish wedge pattern to form above the MACD line. This combination can be a good way to confirm that the pattern is valid and the market is likely to continue in the same direction.
What Does Wedge Pattern Tell You?
Wedge patterns are reversal patterns that occur at the end of trends. They can be either bullish or bearish, depending on where they form in relation to the trend. Bullish wedge patterns form at the end of downtrends and are considered reversals because they indicate that the market is likely to start moving up. Bearish wedge patterns form at the end of uptrends and are considered reversals because they indicate that the market is likely to start moving down.
The psychology behind wedge patterns is that they occur when the market is tired and ready to reverse. Bullish wedge patterns form when sellers are no longer willing to push the market lower and buyers start to step in. Bearish wedge patterns form when buyers are no longer willing to push the market higher and sellers start to step in. These reversal patterns can be a good way to trade the end of trends.
Other Chart Patterns In Forex Trading
There are a few other chart patterns that you should be aware of if you want to trade forex successfully. These include;
Head and Shoulders Patterns
Head and shoulders patterns are reversal patterns that occur at the end of trends. They form when the market makes a higher high followed by a lower high, and then makes another lower high. This forms the left shoulder, head, and right shoulder of the pattern. The neckline is drawn through the lows of the left shoulder and head. A break below the neckline signals a potential reversal. A reversal is confirmed when the market breaks below the neckline and moves to new lows.
Double Tops and Bottoms
A double top is a chart pattern that forms when the market makes two highs that are almost at the same level. A double bottom is a chart pattern that forms when the market makes two lows that are almost at the same level. These patterns can be used to trade reversals by entering short after a double top is formed or entering long after a double bottom is formed.
Triple Tops and Bottoms
A triple top is a chart pattern that forms when the market makes three highs that are almost at the same level. A triple bottom is a chart pattern that forms when the market makes three lows that are almost at the same level. These patterns can be used to trade reversals by entering short after a triple top is formed or entering long after a triple bottom is formed.
Cup and Handle
The cup and handle pattern is a bullish reversal pattern that forms at the end of downtrends. It consists of two parts; the cup and the handle. The cup forms when the market makes a lower low followed by a higher low. The handle forms when the market pulls back from the highs of the cup. A break above the highs of the handle signals a potential reversal. A reversal is confirmed when the market breaks above the highs of the handle and moves to new highs.
FAQs About Forex Wedge Patterns
1. What is a wedge pattern in forex trading?
A wedge pattern is a reversal pattern that occurs at the end of trends. They can be either bullish or bearish, depending on where they form in relation to the trend. Bullish wedge patterns form at the end of downtrends and are considered reversals because they indicate that the market is likely to start moving up. Bearish wedge patterns form at the end of uptrends and are considered reversals because they indicate that the market is likely to start moving down.
2. How to identify a wedge pattern in forex charts?
Wedge patterns can be identified by looking for two converging trendlines that form a triangle. The trendlines should be drawn through the highs and lows of the price action. A bullish wedge pattern forms when the trendlines converge towards each other from below and a bearish wedge pattern forms when the trendlines converge towards each other from above.
3. How to trade a wedge pattern in forex?
Wedge patterns are traded by entering long after a bullish wedge pattern forms or entering short after a bearish wedge pattern forms. The stop loss is placed below the low of the bullish wedge pattern or above the high of the bearish wedge pattern. The target is typically the same as the height of the pattern.
Read more: