Triangle pattern trading is among the popular pattern trading: it is subjective to changes, not always accurate, and varies based on the market. Another important thing regarding triangle pattern trading is the display of bulls and bears battle for change. Many investors would rather predict a particular movement and hope it goes according to the plan.
However, triangle pattern trading does not always work this way: you should prepare for changes in both directions, not only on one side. Triangle pattern trading indicates either a bull or bear market – thus, you should predict both and make a plan accordingly.
For example, the continuation pattern is the main deal behind triangle pattern trading. The continuation pattern explains that the price continues in the initial trend direction (before the pattern occurs) after the pattern completes. You need to understand the concept of continuation pattern and support/resistance before you can make a great deal out of triangle pattern trading.
The triangle pattern is confirmed when there is a minimum of five varied levels of support and resistance. For example, there may be three (or more) support lines and two (or more) resistance lines. Or vice versa. The crucial information is that there should be at least five levels of support and resistance.
The line of support and resistance brings us to the types of triangle patterns: symmetrical triangle pattern, descending triangle pattern, and ascending triangle pattern.
Continuation pattern and its importance in triangle pattern trading
Continuation pattern is the illustration explaining triangle pattern trading: the pattern signifies that price continues in the initial trend even after the trend passes. Continuation pattern is the basis for explaining triangles, flags, rectangles, and pennants. However, we shall only consider the continuation pattern’s importance in determining the triangle pattern when trading.
Continuation shows that the price trend continues in the same movement after a continuation pattern passes. Please, note that the word “tendency” is important in explaining continuation and triangle pattern trading. There is a high probability that the trend follows the same trend after the continuation pattern plays out – however, it is not always certain.
The trend will certainly continue in one of the two directions; thus, the triangle pattern teaches you to predict in both directions (however, you may prefer the initial trend direction). Traders make the mistake of following the possible way, whereas there are two possible ways. It is not always a hundred percent that the trend resumes the direction after the pattern passes – an efficient trader would consider both directions. At least, making the least possible way the plan B.
In other words, traders ask, “what will I do when the trend resumes its initial direction?” however, they should have asked, “what will I do when the trend resumes its initial direction or move contrarily?”
A continuation pattern does not give you a hundred percent certainty that the trend will follow the initial direction – it, however, tells you to prepare both directions.
Effective traders wait for the breakout to see what will be before passing judgment on the continuation pattern. Not all continuation patterns work according to the definition. Many results in reversals.
Application of continuation principles in triangle pattern trading
We cannot neglect a continuation pattern’s importance because it may fail. However, there is a more positive move behind the principle. For example, you may rely more on the continuation principle if the strong trend moves towards the pattern with a small continuation pattern compared to the trending waves.
In other words, the continuation principle applies to triangle pattern trading if:
- A strong trend moves into the pattern
- A small continuation pattern appears compared to the trending waves
The implication of the above is that the price rises strongly (with a small triangle pattern), collapse above the triangle pattern, and moves higher. Contrarily, (if the continuation pattern is not favorable) – the price falls strongly (with a high triangle pattern), does not break above the triangle pattern, and moves low.
The notable interpretation of continuation in triangle pattern trading
Assuming the continuation takes the same size as the preceding trending waves, it implies increased volatility, uncertainty in the trending direction, and enormous forces against the trend. The three implications are red flags. It would help if you were careful in deciding the next move when you interpret the triangle pattern trading and notice these signs. Red signs are red signs – even if they turn good luck in the end, it may not be worth the risk.
Another is the case of “small trending waves” and “continuation patterns.” You may not necessarily bother if the continuation pattern does not succeed in the small trending waves. However, it would be good to be extra careful if the continuation patterns follow the small trending waves.
The best way to use a triangle pattern via continuation is to draw trendlines around the pattern – this requires that you wait for the pattern to form.
Ascending triangle pattern

Higher lows and resistance levels are the signs of ascending triangle. Buyers are prominent effectors when these two occur: there is a particular resistance level that buyers cannot overcome. Thus, an ascending triangle is a chart that happens when there is a slope of higher lows and resistance levels. The higher lows indicate that buyers try to push the price up because they cannot exceed the level – buyers gain strength in the market.
When buyers put more pressure on the resistance level, a breakout may happen; even if it eventually happens, in which direction? Buyers putting more pressure does not indicate that the breakout will happen – there are situations where the resistance may be stronger than the pressure.
Buying power determines the end: if buying exceeds the resistance level, it will break it, and buyers gain more strength. However, it is not always like this. Many traders show that buyers always win. No, this is not always true – the buying power determines everything.
Let us get it right – triangle pattern trading is simply a prediction of price direction, where traders use this in their favor as much as ascending triangle pattern tells us that the price goes up (does not mean it will always go up). How about working in both directions instead of predicting that it will always go up? Make the true belief that ascending triangle pattern goes up (your plan A) and in the other direction (your plan B).
The price does not go up if the resistance is too strong or the buying power is low. However, it would be more effective if there was a way you could verify the buying power or resistance level. You would settle for the best option (up or down direction based on your findings.
You may set two entries instead of one when trading ascending triangles: put one entry at the top of the resistance line and another below the higher lows.
An ascending triangle is considered a significant continuation pattern if it happens between an uptrend or downtrend. A short trade is beneficial if the price breaks below the lower trendline.
Conversely, a long trade is beneficial for ascending triangle if the price breaks above the top of the pattern. Working with stop loss is performed by placing the stop loss barely outside the pattern; it is best on the other side of the breakout.
Interpretation of ascending triangle and what it tells you
Recall that an ascending triangle is considered a significant continuation pattern if it happens between an uptrend or downtrend. A short trade is beneficial if the price breaks below the lower trendline. When this happens, investors are prone to buying or selling security based on the direction the price broke out.
Volume increases as the breakout happens, which also confirms the breakout. The combination of two swings lows and two swings highs form the ascending triangle’s trendlines. The more the trendlines, the higher the validation of the results because the trendlines meet one another; suppose the price move in the triangle for multiple swings creating coiled and stronger price action that may breakout at the end.
Trending periods oppose consolidation periods because stronger volumes occur at this point. Triangle is typically a consolidation; thus, volume contracts instead of having a strong effect during ascending. Once the breakout happens, volume increases – traders look out for this as it indicates that the price may continue in the breakout direction.
Descending triangle pattern
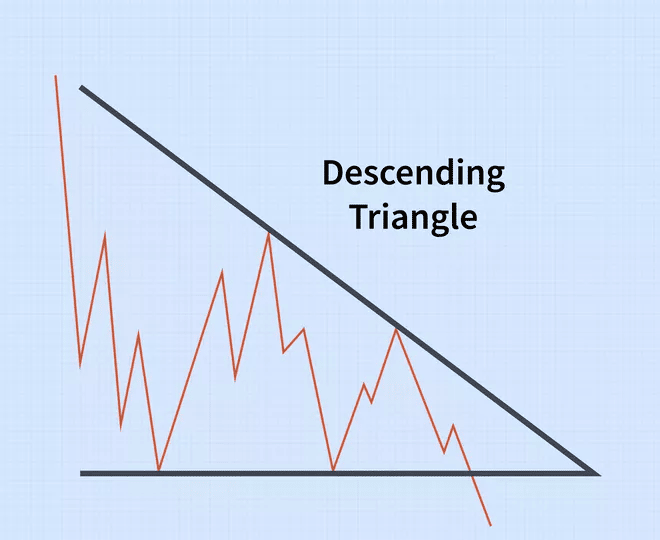
The descending triangle pattern is the opposite of the ascending triangle, just like other patterns and technical analyses. So, most of the things discussed below are the inverse of ascending triangle pattern. It is necessary to talk about them because they are essential, like the ascending pattern. Therefore, read them line by line.
Unlike ascending triangle pattern, lower lows and support levels are the signs of ascending triangle. Sellers are prominent effectors when these two occur: there is a particular support level that sellers cannot overcome. Thus, a descending triangle is a chart that happens when there is a slope of lower lows and support levels. The lower lows indicate that sellers try to push the price up because they cannot exceed the level – sellers gain strength against the buyers.
When sellers put more pressure on the support level, a breakout may happen, and the price may continue to fall. The best is that we do not care about the direction (unlike the ascending triangle pattern). Sellers putting more pressure does not indicate that the breakout will happen – there are situations where the support line may be stronger than the pressure.
Let us get it right – triangle pattern trading (in case of descending pattern) predict price fall (without much concentration on the direction). Traders use this in their favor; however, it does not mean the price will always go down.
The descending triangle focuses majorly on downtrends and signifies a bearish signal: the descending triangle is the inverse image of the ascending triangle.
If you consider the charts below:
- The descending triangle takes the same time in development as the ascending triangle.
- The volume plays a crucial role in the breakout to the downside.
- Increase/decreased volumes play an important role in the technical analysis.
Symmetrical triangle pattern
Up to this point, we have seen two triangle patterns: the ascending pattern indicates a bullish market move, and the descending pattern indicates a downtrend with an unequivocally bearish look.
Symmetrical triangles, then again, are considered continuation patterns created in business sectors that are generally aimless in movement. The market appears to be sluggish toward its. The market interest (supply and demand) appears to be very similar.
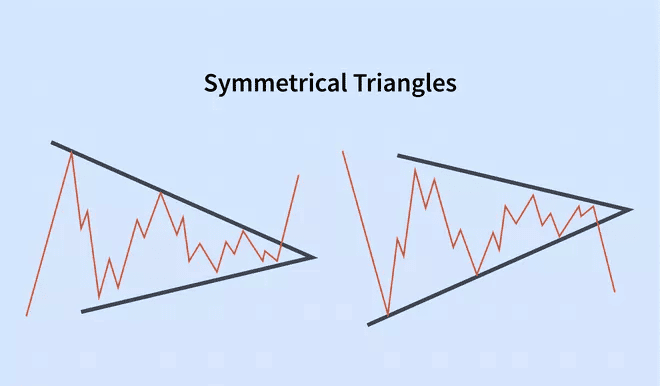
During this time of hesitation, the ups and downs appear to meet at the place of the triangle with no critical volume. Investors always have the foggiest idea of what position to take.
In any case, when the traders truly do sort out what direction to take the issue, it travels up or down with a large volume, contrasting with the ambivalent days and weeks paving the way to the breakout. The breakout, for the most part, happens toward the current pattern. Be that as it may, assuming you are searching for a section point following a symmetrical triangle, make a splash at the breakout point.
Summary of important points
- Understanding continuation pattern and support/resistance improves triangle pattern trading
- Higher lows and resistance levels are the signs of ascending triangle. Buyers are prominent effectors.
- Lower lows and support levels are the signs of ascending triangle. Sellers are prominent effectors
- Symmetrical triangles are in markets that are (mostly) aimless in movement.
Read more: