It would help if you clearly understood the reason behind the application of W and M pattern trading, even though the importance of this pattern trading is essential to all technical traders. The “letter W” has two dots in the downward position, while the “letter M” has similar dots in the upward position. The illustrations of dots in both letters are the main deal in the “double top and double bottom patterns.” In other words, the double top means “letter M,” and the double bottom means “letter W.” Mean is W Pattern Trading.

Traders apply this pattern in several trading options: technical analysis, figuring/defining trading strategy, identifying security movement, and identifying recurring patterns.
Identifying double top and bottom patterns is easy with the concept of “letters W and M.” however, the implication of the two patterns is crucial to losing or gaining in trades. The double top denotes bearish reversal; conversely, the double bottom denotes bullish price movement.
Trading is not static: your prediction/interpretation of market movement may not be the reality. Thus, certain conditions may alter the trading expectation even after predicting with the technical analysis method. In short, all these patterns work as a pointer (they are not a hundred percent accurate). For example, the market may behave otherwise even after you interpreted/predicted a bullish price movement following the W and M pattern trading application.
It is better to work on the technical analysis techniques because either you predict or not; the market lives on! Analyzing your market and “how to trade” is a way to prepare for trading while reducing loss and maximizing profits. Let’s talk more about the double top and double bottom tradings.
Understanding the “W Pattern Trading and M Pattern Trading.”
Letters “W and M” are plain alphabet – you should not expect the same geometry representation in your trading charts. The shapes (peaks and troughs) are not necessarily in the same points before you deduce W and M patterns. This is important because market behavior does not always give this representation.
W and M patterns evolve over an extended period: you cannot use the present price behavior in deducing a conclusion about these patterns. Many underlying reasons give “peaks and troughs” in a trade, which is why “W and M patterns” are best used in conjunction with other indicators. Do not get it wrong; you can use the patterns independent of other indicators – however, working with other indicators verifies your approaches and reduce risk/fakeouts.
M pattern (Double top pattern)
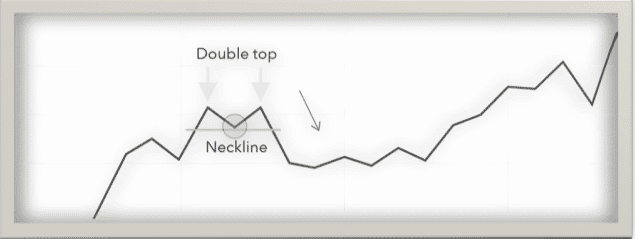
The M pattern is a consecutive rounding tip: the first top comes from an upside-down U pattern, and the second top is usually below the first. The pattern occurs following a bullish rally – thus, the pattern is considered an indicator for a bearish reversal.

The second top falls below the first one, indicating resistance and exhaustion. Although a double top pattern can be rare, it gives investors a hint to obtain final gains from the bullish trend. Traders gain if they sell the stock on a downtrend during a double top pattern.
Again, the first top comes following a strong bullish trend and will retrace to the neckline (the peak above the support level). If the trend follows this pattern, it will continue until it forms the second peak (however, this peak usually falls below the first peak).
Understanding double top pattern
For instance, assuming an asset A reaches two high prices (consecutively); however, there is a slight decline between the prices. Do not underestimate the effect of the double top pattern, most especially if you predict a wrong double top pattern. A double-top pattern is not easy to spot: it would be best to confirm the pattern (by considering the support level) before you make a decision.
Confirming double top pattern
First, the first top comes from an upside-down U pattern, and the second top is usually below the first. Second, the trend (during the second peak) retraces more significantly than it did during the first peak. Lastly, a double top pattern is confirmed when the security’s price goes below a support level – the same as the declines between the two high prices.
For example, let’s assume an asset chart display between September and October of a year, with a stock price of $2,050. The crucial support level is $1,880. What would be your conclusion assuming the price falls as far as 8% from the October peak to support at $1,880?
Answer: the double top pattern is not confirmed until the price falls below $1,880. So, if the stock falls near $1,880 (but not below), the stock will likely increase again. Finally, it is not double top until a stock falls below the support line.
Interpreting double top pattern
The double top pattern shows price movement breaks out of the neckline level of support. Thus, a bearish trend initiates, which may last long.
Using double top pattern You may open a short position at the second peak. Doing this, you look for the bearish reversal that may occur (following your prediction, as per the double top pattern).
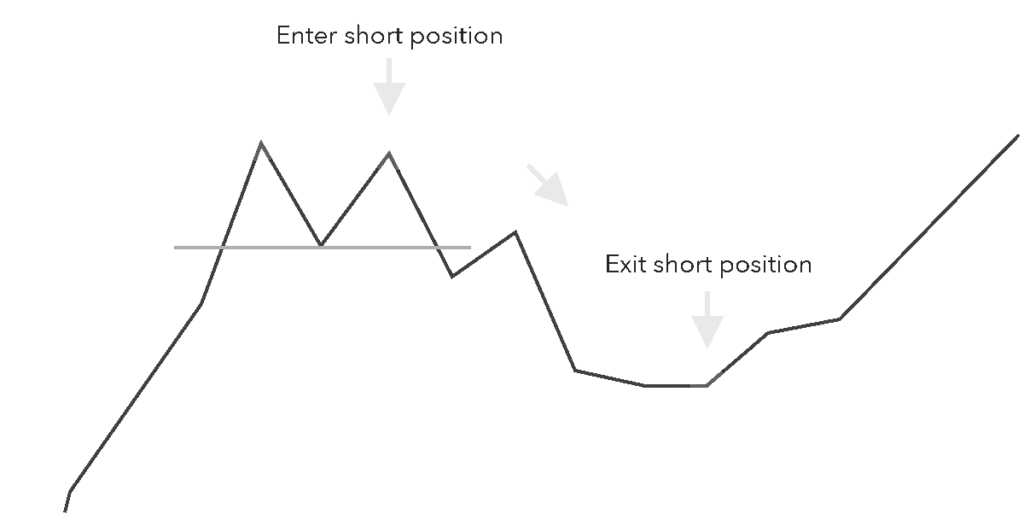
Consider the chart. As it shows, the trend before the double top example is bullish, demonstrating increasing market value. In this example, the descending movement stops at the initial peak and returns to the neckline.
If it had proceeded with lower, the example would have been void. All things being equal, it bounced off the neckline and continued bullish movement. This lasted for a short period before the security lost momentum again. Here, the retracement passes through the neckline showing a prominent reversal in the net movement of the security’s value.
An investor would attempt to open a short position at the height of the second peak to benefit in this example. They would probably leave their short position as an early indication that the trend would be bearish again.
Similarly, as with a double top example, investors can utilize stops while exchanging the double top to shield the trade from loss if the market keeps rising after the subsequent peak.
Failed double top and double top
A failed double top arises from concluding a double top without checking the support line. It is mandatory to check the support line even if you are sure of the peaks and notice an ideal two peaks. Again, there are several reasons for the formation of double peaks – confirming with support line gives a real double top.
W pattern (Double bottom pattern)

The double bottom pattern is the opposite of the “double top pattern.” The W pattern results from single rounding bottom and may indicate the initial sign of reversal. The pattern usually occurs at the end of the extended bearish trend – thus, the pattern is considered an indicator for a bearish reversal.
The W pattern is a consecutive rounding bottom, and investors may maximize this by capitalizing on the last push lower (keeping the support level in mind). Unlike the double top, the W pattern indicates a bullish reversal, meaning that investors make profits from the bullish rally. The profits come from rising asset prices.
Understanding double bottom pattern
The double bottom pattern comprises two lows beneath a resistance level, unlike the double tops (which have it below the support level). Again, the W pattern is a consecutive rounding tip: the first bottom comes following a bearish trend; it stops and follows a bullish retracement concerning the neckline. The pattern usually occurs following a bullish rally – thus, the pattern is considered an indicator for a bearish reversal.
When the bullish trend meets the neckline, it should bounce back and enter a bearish trend again until it moves to bullish, which will frame the subsequent low. The trend should turn into a bullish movement when the subsequent low is formed.
Confirming double bottom pattern
The trend is affirmed when the bullish trend gets through the neckline level and goes on upwards. Numerous investors will try to enter a long situation at the subsequent low. The bullish reversal is implied in the cost graph underneath.
Interpreting double bottom pattern
Recall that the W pattern indicates a bullish reversal, meaning that investors make profits from the bullish rally. The profits come from rising asset prices.
Using double bottom pattern
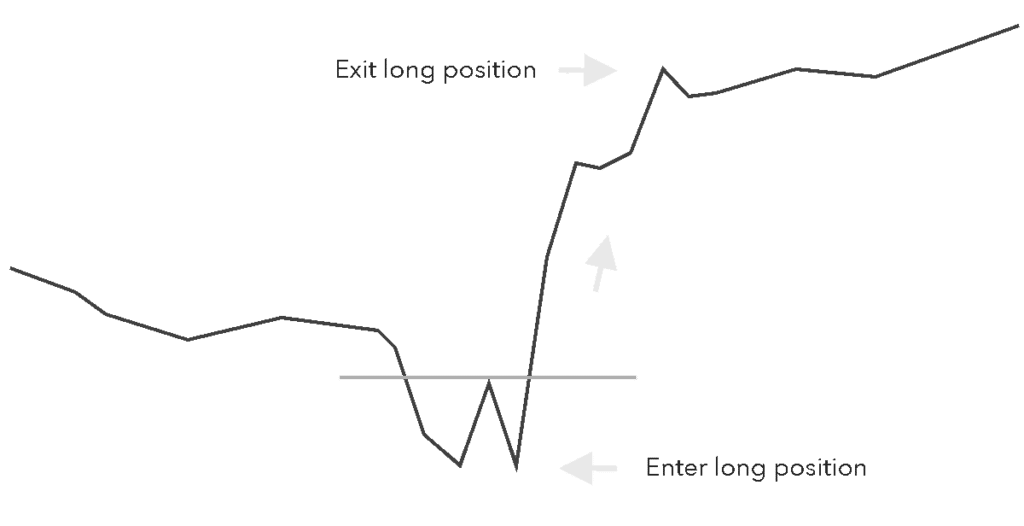
Consider the chart. As it shows, the trend before the double bottom example was bearish, demonstrating this market was valued depleting. In this example, the descending movement stops at the initial low and returns to the neckline.
If it had proceeded with higher, the example would have been void. All things being equal, it retraced the neckline and continued the bearish trend before the primary low. That force at last halted and the subsequent low was shaped. Here, the trend encountered a more long-lasting reversal and went up through the degree of resistance as the neckline.
An investor would attempt to open a long situation at the subsequent low to benefit in this example. They would probably leave their long situation at an early indication of a reversal in the overarching trend so that it would be bearish by turn.
Similarly, as with a double top example, brokers can utilize stops while exchanging the double bottom to shield the trade from misfortune if the market keeps falling after the subsequent low.
Trading with double top
It will help if you keep some rules in mind when trading with double top and one of the rules is the market phase movement. First, consider the market phase (either it moves up or down). The prior trend for a double top should be an uptrend because the double top forms at the end of an uptrend.
The size and type of “formation” are important: you should note if two rounding tops are building up and their sizes. Lastly, you may enter the short position if the price exceeds the support (neckline) if the price breaks the support line.
Double top and stop loss
The second top of the pattern is the best place you can place stop loss when applying the double top pattern to your trading analysis.
Trading with double bottom
It will help if you keep some rules in mind when trading with double bottom and one of the rules is the market phase movement. Check the market phase (either it moves up or down) before making a decision. The prior trend for a double top should be a downtrend because the double top forms at the end of a downtrend.
The size and type of “formation” are important: you should note if two rounding tops are building up and the size. Lastly, you may enter the long position if the price exceeds the resistance (neckline) if the price breaks the resistance line.
Double bottom and stop loss
The second bottom of the pattern is the best place you can place stop loss when applying the double bottom pattern to your trading analysis.
Summary of important points in the double bottom and double top patterns
- Traders apply this pattern in several trading options: technical analysis, figuring/defining trading strategy, identifying security movement, and identifying recurring patterns.
- The M pattern is a consecutive rounding tip: the first top comes from an upside-down U pattern, and the second top is usually below the first.
- The W pattern results from single rounding bottom and may indicate the initial sign of reversal. The pattern usually occurs at the end of the extended bearish trend
- It is mandatory to check the support line even if you are sure of the peaks and notice an ideal two peaks.
- The second top of the pattern is the best position you can place stop loss when you apply a double top pattern
- The second bottom of the pattern is the best position you can place stop loss when you apply a double bottom pattern
Read more: