Understanding Bearish Engulfing Pattern
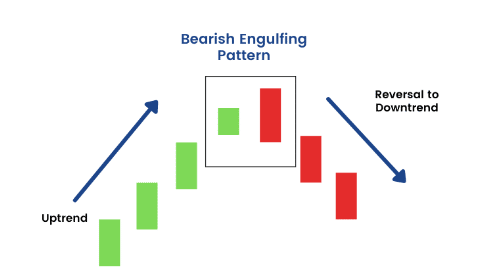
Bearish engulfing is a two-candlestick pattern consisting of one bullish candle and a much bigger bearish candlestick. As the name suggests, it is a bearish engulfing pattern that occurs at the top of an uptrend.
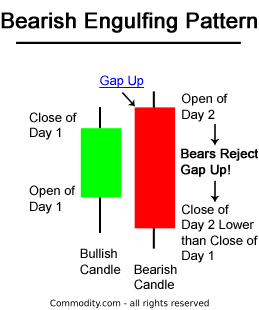
The first candle is bullish in the pattern, signaling the continuation of the underlying uptrend. However, it is accompanied by a large bearish candle that engulfs the bullish candle. The second candle is huge and long with little or no wicks. In this case, the bullish candle is contained within the body of the second bearish candle.
While the pattern can occur anywhere, it tends to provide a much more accurate bearish reversal signal when it appears at the end of an uptrend affirming waning upward momentum.
How to Identify Bearish Engulfing Pattern
In order to deem a pattern as bearish engulfing, the following points must hold:
- The market should be in an uptrend, with bulls making higher highs
- The first candle of the pattern should be bullish, affirming buyers in control
- The second candle should be bearish with small wicks at the top and bottom
- The bearish candle should engulf the bullish candle from top to bottom
What the Bearish Engulfing Pattern Implies
The bearish engulfing pattern implies an unexpected change of sentiment in the market. While initially, the market is moving up, affirming bulls in control, the second candle implies a different thing. While the second candle opens and gaps up, signaling that bulls are still in control, bears join the fray in volume and prevent bulls from pushing prices higher.
The result is price is pushed lower and eventually ends up closing much lower from the previous low of the bullish candle. The fact that the second bearish engulfing candle engulfs the bullish candle affirms that sellers have overpowered buyers and are likely to continue pushing the price lower.
The bearish engulfing pattern has more reliability in affirming price reversal when the open of the second candle is well above the bullish candle and closes well below the open. The big body for the bearish candle with small or no wicks underscores the strong selling pressure, with bulls not able to counter the same in trying to push the price higher.
Additionally, the pattern is more reliable when it follows a clean move higher. If the price is range bound, it is highly unlikely that the engulfing pattern will fuel a strong move lower. Instead, the price might end up bouncing back immediately.
How to Trade the Bearish engulfing Pattern
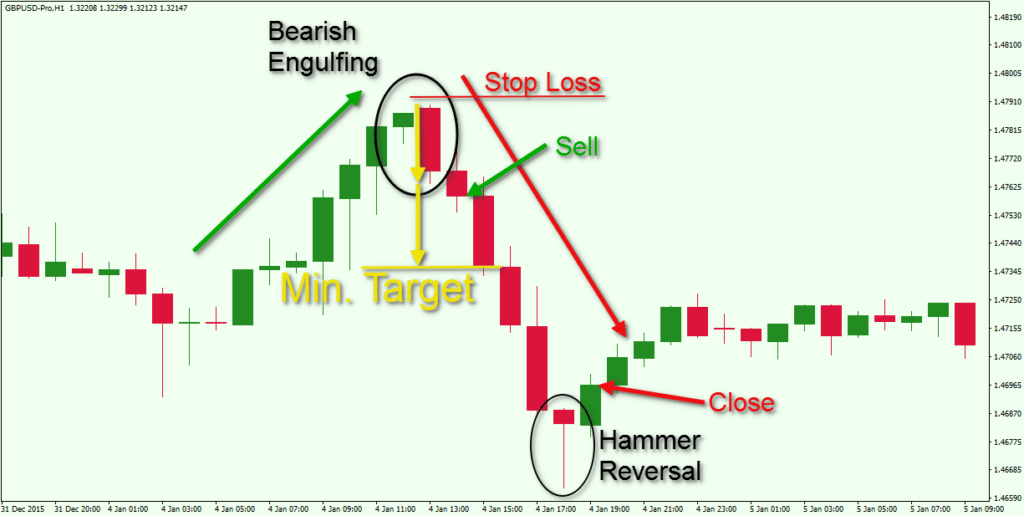
The bearish engulfing pattern occurs when the market appears to be in an uptrend as part of a long-term trend or a short-term correction. For example, in the chart below, the USDCAD pair was moving lower, after which bulls came into the fold and tried to push the price higher. However, the upward momentum experiences strong resistance.
At the peak of the bounce-back price action, bulls come under pressure, forming what appears to be a small bullish candlestick affirming waning upward momentum. Afterward, a strong bearish candle emerges, engulfing the previous bullish candle on closing much lower.

Traders looking to profit from the potential price reversal owing to the bearish engulfing pattern entered a sell or short position as soon as the bearish engulfing pattern closed. The take-profit order is placed where the previous low was before the price started bouncing back.
Likewise, it is important to place a stop loss order to protect oneself against the bearish reversal failing to materialize and eventually moving higher. In this case, the order is placed a few pips above the highs of the bearish engulfing candlestick. In case the price bounces back and moves up instead of going lower, one would be protected against accruing significant losses on the failed bearish engulfing breakout.
What is a Bearish Engulfing breakout?
A bearish engulfing breakout occurs during an uptrend, whereby bulls come under immense pressure after pushing prices significantly higher. Once a bearish candlestick that engulfs the previous bullish candlestick emerges, traders interpret the same as momentum shift from bullish to bearish.
What follows is a bearish engulfing breakout whereby prices, more often than not, break out to the downside. The sell-off can occur in force if the underlying volume from short sellers is strong enough. In contrast, a false breakout occurs when the bearish engulfing pattern fails to trigger a strong price move to the downside. Instead, the price bounces back almost immediately and closes above the bearish engulfing candle.
Once prices have moved lower, there is always the risk of bulls coming back into the fold, overpowering bears and pushing prices back to the previous high. Prices bouncing back after a bearish engulfing pattern are often interpreted as a false bearish engulfing breakout.
Bearish Engulfing Pattern At Resistance
The bearish engulfing pattern provides a much more accurate reversal signal when it occurs at a strong resistance level. At resistance, it is expected that bulls will struggle to push the price higher as most of them exit the market to lock in profits or bears enter the market to try and sell at a high.
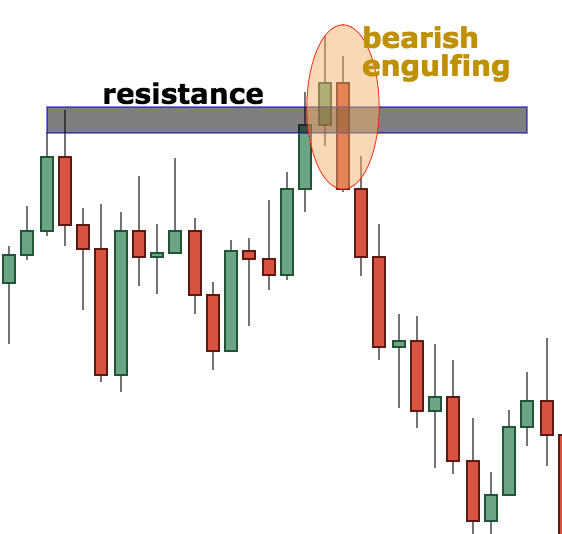
The chart above clearly shows that bulls pushed prices above the resistance level. However, they came under pressure from sellers who exited the market and used the opportunity to sell at a new high. The emergence of a bearish candlestick that engulfs the previous bullish candle affirms that bears have overpowered bulls and are poised to lower prices.
With the resistance level slightly above, traders used the opportunity to enter sell positions with a stop loss order and placed a few pips above the previous high.
Bearish Engulfing with Relative Strength Index
The relative Strength Index is an important technical analysis tool that helps traders identify areas where the market is oversold or overbought. When used to confirm a bearish reversal, traders pay close attention to overbought conditions when the indicator readings are above 70.
A reading of more than 70 indicates that buyers have bought the market significantly, and a reversal might occur as many buyers are unwilling to buy at the new highs. The chart below shows that the bearish engulfing pattern emerges as soon as RSI was in the overbought zone.
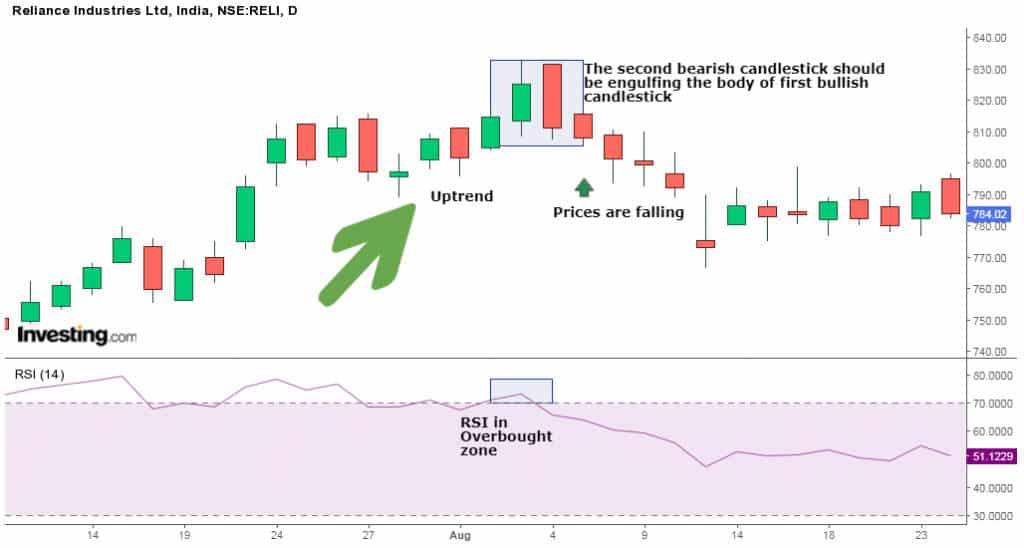
With the RSI in overbought short, sellers interpret the same as an opportunity to sell from overbought levels. Consequently, as soon as the bearish candlestick closed, the price edged lower as more traders placed sell positions to sell at a high.
Bearish Engulfing With Moving Average
Moving averages are other important technical analysis tools that allow traders to identify the underlying trend as well as areas of strong resistance or support. For example, in the chart below, the 200-day moving average affirms that the market is in a downtrend. Of interest is the fact that the price tends to edge lower every time it comes closer to the MA.
It is clear that as soon as the price hits the 200-day moving average, a bearish engulfing pattern emerges, affirming a buildup in selling pressure at the level. The fact that the price edges lower from this level confirm that the MA is a strong area of resistance where traders should expect reversals to the downside
Bollinger Bands, Stochastic, MACD, Moving Average Example
Some technical analysts rely on several technical indicators to ascertain if a reversal is indeed in play after forming a bearish engulfing pattern. The stochastic being momentum indicator provides accurate signals of where the market is overbought, which is an area of interest for anyone looking to take advantage of the bearish reversal candlestick.
The Bollinger Bands also come with upper and lower bands. The upper band, in this case, is of utmost importance. In most cases, it is expected that as soon as the price moves to the upper band, it will tank and retrace to the middle of the band as short sellers enter the market.
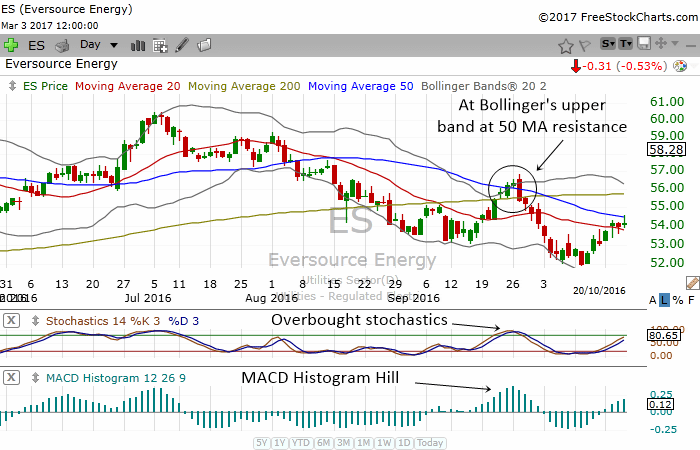
In the chart above, the Bollinger Bands, moving average stochastic, and MACD is all in play. The bearish engulfing pattern emerges after the price has moved to the upper band of the Bollinger band indicator. It is also clear that the high price points get rejected with short sellers entering the market on pushing the price below the upper band and below the 50 MA, acting as an area of resistance.
Traders looking to profit from the bearish reversal pattern can rest easy on selling at the highs, given that the stochastic indicator shows overbought conditions. The overbought conditions indicate the price is much higher than it should be.
The MACD Histogram also provides a reversal signal as the hill starts to contract, affirming easing upward momentum. Conversely, as the histogram n edges lower, so do price-affirming bears in control and likely to continue pushing prices lower.
Bearish Engulfing Success Rate
Bearish engulfing is a popular and well-known bearish reversal pattern with a high success rate of 79%. When the pattern occurs in more extended time frames, such as daily and weekly, it tends to affirm the prospect of price reversing from an uptrend to a downtrend.
The pattern tends to have a high success state when the bearish candlestick is supported by heavy volume asserting the intense selling pressure that bears are likely to struggle to counter. However, like any other pattern, it cannot be relied on its own to make a trading decision.
It is best practice to confirm that a bearish reversal is likely to occur after the bearish engulfing pattern while relying on other indicators such as RSI stochastic or moving averages.
Bearish Engulfing Pattern Limitations
The bearish engulfing pattern is most useful and provides a reliable bearish reversal signal when the price is in an uptrend. After a strong move up, exhaustion often kicks in, providing an opportunity at a high instead of a low. However, if the price is choppy, the significance of the pattern is diminished as there is usually no big room to the downside to placing a short position.
Secondly, if the bearish engulfing candle is big, one would be left with a small room of earning significant profit to the downside given the strong move lower before triggering a sell position. Additionally, one would be left with a large stop loss on placing it a few pips above the highs of the bearish candle. The risk-reward profile, in this case, will be quite low and won’t make any sense.
With a bearish engulfing pattern, it is also challenging to establish potential rewards as the candlestick doesn’t provide price targets. Instead, one is left with the option of using other indicators in technical analysis to select a price target or determine when to get out of a trade.