What is Morning Star?
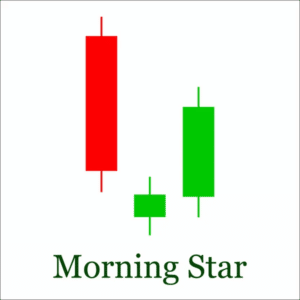
The morning star candlestick pattern is a three-candlestick reversal pattern that indicates bullish signs to technical analysts. The first candlestick is a long bearish candlestick, followed by a small bullish or bearish candlestick, and finally, a long bullish candlestick.
The Morning Star is believed to be an indicator of potential market reversals and, therefore, can be used by traders to enter long positions. Given the signal’s potential importance, it is worth understanding how to identify the Morning Star pattern and what conditions are necessary for it to form.
The formation of a Morning Star pattern typically occurs near the end of a downward trend in the market, and it is indicative of a possible shift in the market’s direction.
For the pattern to be valid, the following criteria need to be met: The downtrend must be clearly defined by lower highs and lower lows. The formation of the black candlestick is required inside this downward trend, and ideally, it should have a relatively long body.
The small candlestick that gaps below the black candle should close within the body of the black one. Finally, the white candlestick needs to close above the point where the black candle is exactly halfway through its body.
If these requirements are met, it is likely that the market has found support, and it is probable that it will soon start moving higher. Nevertheless, before taking any action, it is critical to wait for confirmation of the information.
An increase in volume can be observed during the formation of a Morning Star pattern, which can be used as a confirmation that the pattern is present. An increase in volume frequently follows large market changes and might lend credence to the argument that a trend is shifting in the other direction.
It is important to keep in mind that the Morning Star pattern is just one component of a larger trading strategy; despite the fact that it may be a very helpful tool for predicting probable market reversals, traders should not rely solely on it.
As it is with all other forms of technical analysis, the Morning Star pattern should not be used in isolation but rather in conjunction with many other strategies, such as fundamental analysis, in order to arrive at an informed trading decision .
Morning Star Pattern Screener
While many different websites offer screener services, Trendlyne[dot]com, Chartink[dot]com, Screener[dot]in, and Topstockresearch[dot]com are four of the most popular ones.
All four of these websites offer users the ability to screen for stocks using various criteria, including price, volume, technical, and fundamental indicators.
In addition, all four of these websites offer users the ability to create custom screens and save them for future use. Trendlyne[dot]com and Chartink[dot]com also offer users the ability to backtest their screens against historical data to see how well they would have performed in the past.
By using one or more of these sites, you can quickly and easily find stocks that may be about to make a move higher.
How to Trade a Morning Star?
There are a few essential factors you need to keep in mind while trading with a Morning Star pattern. First, it is essential to note that the volume has been increasing steadily during the course of the pattern’s three sessions. It is expected that the volume would peak on the third day.
Second, traders want to take a bullish position in the stock/commodity/pair/etc. and ride the uptrend until there are signs of another reversal. Third, the formation of the morning star during the third session is considered to be proof that the pattern is correct (and a future upswing).
Keeping an eye out for other indications, on the other hand, is also quite important. Fourth, a significant increase in volume on the third trading day is typically interpreted as a validation of the pattern (and a future upswing).
In conclusion, keep in mind that although the Morning Star pattern can be exploited as a visual indicator of the beginning of a trend reversal from bullish to bearish, its significance is amplified when other technical indicators support its interpretation.
The Doji Morning Star Pattern
Alt text = The Morning Doji Star image
The Doji Morning Star Pattern is formed when a Doji, or a candlestick with a very small body, gaps below the previous candlestick and then rallies to close above that candlestick open.
The significance of this candlestick pattern is that, despite the bears temporarily winning the battle, the bulls were able to come back and eventually win. This can be seen by how the Doji has a long upper shadow, which shows that the bears tried to push prices lower but eventually failed.
The morning star component of the pattern is derived from the candlestick pattern discovered near the bottom of a bearish trend and indicates the possibility of a trend reversal.
While it is not always 100% accurate, the Doji Morning Star Pattern is a valuable tool that traders can use to make better-informed decisions.
The Difference Between a Morning Star Pattern and a Doji Morning Star Pattern
The key difference between the morning star pattern and the Doji morning star pattern is that the middle candlestick in the latter is a Doji, a candlestick with an open and close price that is virtually equal.
This small variation in price action can signal a weaker reversal than a typical morning star pattern. However, both patterns are typically found at the end of a downtrend and can signal a potential turning point in the market.
Disadvantages of Using the Morning Star Pattern
Many investors believe that trading solely on visual patterns is dangerous. One of the most commonly cited reasons is that it can be difficult to distinguish between a genuine trend reversal and a false signal. This is particularly true of the morning star pattern, which is often seen as an indicator of a bullish reversal.
However, morning stars can also occur amid a downtrend, making them difficult to interpret. For this reason, many traders believe that morning stars are only effective when they are accompanied by volume and another sign, such as a support level.
Without these confirmations, they argue it is too risky to trade alone on a morning star pattern. While there is no guarantee that using additional indicators will always lead to successful trades, many experienced investors believe it is the best way to avoid false signals and minimize losses.
Morning Star vs. Evening Star
Alt text = The Morning Star and Evening Star image
The Morning Star and Evening Star are both reversal candlestick patterns found at the top or bottom of a price trend.
Both patterns consist of three candles, with the middle candle being smaller than the other two. The difference between the two patterns lies in the orientation of the candles.
While both patterns can be useful in identifying potential reversals, it’s important to remember that they should not be used as the sole basis for trading decisions. Instead, they should be used in conjunction with other technical indicators to confirm the strength of the reversal signal.
In a morning star pattern, the small middle candle is between a large bullish candle and a bearish candle. This pattern appears at the bottom of a downtrend and signals that the trend is reversing and heading upwards.
An Evening Star pattern, on the other hand, consists of a large bullish candle followed by a small-bodied candle and then a bearish candle. This pattern appears at the top of an uptrend and signals that the trend is reversing and heading downwards.
The morning star pattern occurs when there is a bullish reversal from a significant support level. This pattern indicates that sellers have failed, and buyers are now in market control. From a morning star pattern, traders should look to open long positions.
The evening star pattern occurs when there is a bearish reversal from a significant resistance level. This pattern indicates that buyers have failed, and sellers are now in control of the market. From an evening star pattern, traders should look for opportunities to short the market.
Identifying these candlestick patterns is an essential tool for every trader. By understanding these patterns, traders can better navigate the market and make more informed trading decisions.