What is an Inverted Hammer?
An Inverted Hammer (or inverse hammer) is a candlestick pattern typically seen at the bottom of a downtrend. It is a bullish reversal pattern, signaling that there is potential for the price to begin moving upwards. The Inverted Hammer occurs when there is pressure from buyers to push the asset’s price up. The Inverted Hammer is considered a single Japanese candlestick pattern.
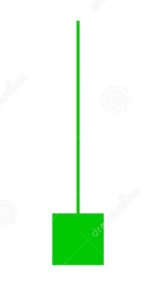
It is formed when the open, high, and close are about equal, and there is a small real body and a lengthy upper shadow. The inverted hammer’s long upper shadow indicates that buyers were unsuccessful in pushing the price higher.
However, the fact that buyers were able to push the price up from the open indicates that there is potential for further upward movement. An inverted hammer followed by a bullish candlestick is considered a strong indication of an upcoming bullish trend reversal.
When the inverted hammer is found at the higher time frames, such as four hourly or daily, analysis of historical charts shows it would have performed better if used as a contrarian signal. In other words, it would have worked better as a sell entry than a buy.
In general, market participants tend to overreact at the beginning of a move, which means that prices often exceed fair value by some percentage before finally leveling off or correcting. Hence, trading the Inverted Hammer can be an effective way to capitalize on these overreactions.
Inverted Hammer in an Uptrend
After a period of consolidation or a pullback, an inverted hammer candlestick may appear during an uptrend to indicate that buyers are getting ready to enter the market and drive prices higher. For an inverted hammer to be valid, the candlestick should have a small body with a long upper shadow.
The long upper shadow indicates that sellers tried to push prices lower, but buyer demand was strong enough to push prices back up and close near the highs of the session.
The small body is a sign of indecision between bulls and bears, but ultimately the bulls were able to prevail. Inverted hammers form in both uptrends and downtrends, so it is important to confirm the trend before taking any action.
If prices are in an uptrend and an inverted hammer candlestick forms, it may be a good idea to enter a long position. However, if prices are in a downtrend and an inverted hammer forms, it may be best to wait for prices to move lower before entering any trades.
Bearish Inverted Hammer
A bearish inverted hammer is a shooting star that occurs after an uptrend. In other words, it’s a type of candlestick pattern that can signal a potential reversal in price. The bearish inverted hammer is a candle formation that can indicate a potential price top and reversal.
The inverted hammer candle performs best when it develops following a string of three or more successive candles that have greater highs. Even if a few recent candles are bearish, it can still happen during a time when prices are generally rising.
Inverted hammers can be found at the top of uptrends and within downtrends. They can also be found in isolation but are less reliable in this case. When an inverted hammer forms after a series of rising candles, it suggests that the bulls are losing momentum and that the bears are starting to take control.
This is often followed by a period of price consolidation or a small pullback as the market decides which way to go next.
Advantages of the Inverted Hammer Candlestick
The Inverted Hammer Candlestick is a bullish candlestick pattern that can be used to signal a potential reversal in the markets. There are several reasons why this pattern can be advantageous for traders:
- Favorable entry points: The Inverted Hammer Candlestick can provide traders with favorable entry points into the market. This is because the pattern indicates that the market has reached a point of exhaustion and is potentially ready to reverse. When the market does reverse, traders who have entered at these favorable levels can stand to make a profit.
- Require less research: Inverted Hammer Candlesticks require less research than some other candlestick patterns. This is because the pattern is relatively easy to identify on a chart. As such, traders can spend less time conducting analysis and more time actively trading.
- Easy to Identify: As mentioned above, the Inverted Hammer Candlestick is easy to identify on a chart. This makes it an ideal pattern for new or inexperienced traders who may not be familiar with all of the different candlestick patterns.
Limitations of the Inverted Hammer
The Inverted Hammer is a candlestick charting pattern that many traders believe can signal a change in the market trend, from bearish to bullish. However, there are some limitations to this indicator that traders should be aware of before making any decisions based on it.
Firstly, the inverted hammer may not always indicate long-term changes in the market trend. It can sometimes be just a brief reversal before the price continues to move in the same direction.
Second, over-reliance on a single candlestick pattern can lead to missing other important information that could impact your trade. For this reason, it’s always best to use multiple indicators in conjunction with each other to get a complete picture of the market.
Taking these limitations into account will help you make more informed trading decisions and avoid potential pitfalls.
Things You Should Look for when Trading with Inverted Hammer
There are things you should look for when trading with Inverted Hammer.
- Confirm that the market is in a downtrend before Inverted Hammer forms. This can be done by looking at the trendline or using other technical indicators such as moving averages.
- Look for confirmation of the Inverted Hammer pattern with another candlestick. This means that the next candlestick after Inverted Hammer should be bullish, preferably with a gap up from Inverted Hammer’s close price.
- Be aware of false positives. Inverted Hammer is often found in areas of support or resistance, so make sure that prices are reversing before entering into a trade. Also, don’t get confused with other candlestick patterns, such as Shooting Star, which has bearish implications.
How to Achieve Greater Accuracy When Using the Inverted Hammer
In order to increase the accuracy of your inverted hammer trades, you should pay attention to the overall market trend, seasonality, time of day, and volatility.
In terms of the overall market trend, it’s important to remember that these types of reversal patterns can occur at different points within the trend.
For example, they might seem to happen at the bottom of the range when looking at a lower chart resolution, but they could actually be occurring at the top of the trend. In order to gain a comprehensive sense of where the market is now trading in reference to previous price action, it is crucial to look at different time frames.
Additionally, seasonality and time of day can also have an impact on your trade results. For example, certain pattern setups may work better during certain times of the year or during specific hours of the day.
And finally, volatility is another important factor to consider. In general, low volatility environments are less ideal for trading inverted hammers than high volatility environments.
This is because there is typically less opportunity for the price to make a significant move in either direction when markets are quiet. When trading this common reversal pattern, it is possible to boost your odds of being successful if you take into consideration all of these aspects.
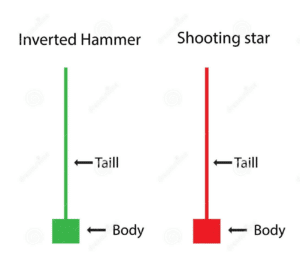
Inverted Hammer vs Shooting Star
Both of these patterns can be indicative of a potential trend reversal, but there are some key differences between them that need to be considered.
The inverted hammer is typically seen in a down-trending market. To qualify as an inverted hammer, the upper shadow must be at least twice the size of the real body.
The color of the candle is relatively unimportant, but if it is green, it can show some bullishness. The inverted hammer typically has a high low range, but this can vary depending on how sharp the downtrend is.
The shooting star is the opposite of the inverted hammer and is typically seen in an up-trending market. As with the inverted hammer, the upper shadow must be at least twice the size of the real body.
The color of the candle is, again, relatively unimportant, but if it is red, it can show some bearishness. The shooting star also typically has a high low range, but this can depend on how sharp the uptrend is.
So, while both the inverted hammer and shooting star can be indicative of a potential trend reversal, some key characteristics distinguish them from each other. It is important to be aware of these distinguishing factors in order to interpret market signals correctly.
FAQs
Is Inverted Hammer Bullish?
The answer is yes; an inverted hammer candlestick signals a short-term downtrend reversal or bullish reversal.
Is an inverted Hammer Bearish?
No, an inverted hammer is a bullish reversal pattern. If the market is trending downwards, the price will open lower, go higher during trading, and then close near where it opened.
The extended upper shadow represents the fact that prices were pushed lower by sellers throughout the trading session, but then were driven back up by purchasers as the trading session came to a conclusion.
How do You Trade with an Inverted Hammer?
In order to trade with an inverted hammer, you must first log in to your trading account. Then, use the ‘finder’ panel to search for the asset you wish to trade. Input your position size, and then choose ‘buy’ or ‘sell’ in the deal ticket. Finally, confirm the trade.
What Should You Do if You Spot an Inverted Hammer Pattern?
If you spot an inverted hammer pattern, you should watch for confirmation before taking action. This means waiting for prices to break above the high of the candlestick, which would confirm that buyers are in control of the market.
Once this happens, you could enter a long position with a stop loss just below the low of the candlestick. Inverted hammers can also be used as breakout trading strategies, so you could watch for breakouts above key resistance levels if you see this candlestick pattern forming.
What Does an Inverted Hammer Pattern Indicate?
The inverted hammer candlestick pattern generally indicates a reversal to the uptrend in the short term. Inverted hammer patterns form after extended declines and prices stabilize near their lows for the period. The pattern is easy to spot on a chart.