This guide will teach you everything you need to know about the piercing line strategy, including how to identify and trade with this pattern. We’ll also provide some tips for improving your results. So whether you’re a beginner or an experienced trader, the piercing line can help you succeed in the markets.
What is a Piercing Line?
The piercing line candlestick pattern is an indication of a bullish reversal that develops near the end of a downtrend. As bulls enter the market and drive prices higher, it frequently results in a trend reversal.
This candlestick pattern is created when buyers drive prices higher to close above 50% of the first candle’s body. The first candle is typically black, and the second candle is white.
The appearance of this pattern is a red flag for sellers since an upward reversal is possible. This pattern indicates that bulls are beginning to enter the market and that prices are likely to move higher. As such, traders should be on alert for potential buying opportunities.
How do you Trade a Piercing Line?
The piercing line candlestick pattern indicates a trend change. However, depending solely on the piercing line pattern to provide a purchase signal may be insufficient. The pattern must be seen in conjunction with other indicators that indicate a buy signal. To make a piercing line pattern, the second candle must cover only half of the first candle.
It is not necessary to cover the entire red candle. It signifies that the bulls could not entirely reverse their losses from the previous day. When additional technical indicators, such as RSI, Stochastic, or MACD, indicate a positive divergence while creating a piercing line pattern, the upward trend is more likely to continue.
Another straightforward but critical factor to examine is the trade volume. If the volume on the second day is higher than usual, it is a stronger indicator that the downward trend is likely to end.
Piercing Pattern Success Rate
Out of all the patterns that technical analysis uses to try and understand markets, the Piercing pattern is one of the more successful.
On average, it confirms 72.9% of the time across the 4120 markets studied. This pattern is generally confirmed within 2.3 candles or invalidated within 4.3.
This pattern is valid since it assists traders in gaining a better understanding of whether the momentum of the market is bullish or bearish. If the market rallies after breaking through a previous low, this indicates that bullish momentum is likely present in the market.
If, on the other hand, prices drop after breaking past a previous high, this indicates that the market is likely to be moving in a bearish direction.
The piercing pattern is a useful tool for traders who are attempting to make sense of the movements in the market, despite the fact that no pattern is flawless.
Formation of a Piercing Pattern
The piercing line candlestick pattern develops over two days, with the first stick dominated by sellers and the second by purchasers. It denotes a trend reversal and hints at a short-term upward advance.
A downward price trend typically precedes the piercing line candle pattern. It indicates that the supply of shares to be sold has reached its maximum, and purchasers have gradually begun to dominate the market, driving up the price of the shares.
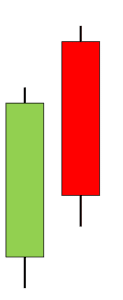
Two consecutive candles make the piercing line candlestick pattern. With an average or wider trading range, the first candle opens near the high and ends near the low. The first candle is red because it represents a downward progression. A green candle follows the red candle; however, some fine signs must be considered.
A piercing candlestick pattern forms when the market is already in a downward trend, the opening price is high, and the selling activity is ongoing. The closing price reaches the bottom at the end of the trading session, forming a bearish candle. This bearish candlestick is typically a Marubozu candlestick with no upper or lower shadows.
The next bearish candlestick’s beginning point is lower than the preceding bearish candlestick’s closing point. The bulls boost their demand, and the price begins to rise. After the day, the bulls prevailed, and the closing price was higher than the center of the previous bearish candlestick.
This pattern indicates a potential reversal in the downward trend, as the bulls can take control and push prices up. Traders may watch for opportunities to enter long positions when this pattern forms.
Pros of Using a Piercing Line Pattern
Many people use it when trading because it is simple and easy to understand. The Piercing Line Pattern occurs when a bearish candle follows a bullish candle, and the close of the second candle is lower than the midpoint of the first candle.
This pattern can be found on any time frame chart but is most commonly used on daily charts. There are many pros to using this pattern when trading.
First, it can help to identify potential trend reversal signals. Second, it can help to confirm other indicators, such as support and resistance levels. Third, it can provide an entry point for trades. Fourth, it can help to identify stop-loss levels. Fifth, it can help to manage risk.
Finally, it can improve the odds of success for a trade. While there are many pros to using a piercing line pattern when trading, it is important to remember that no single indicator is perfect. It is always best to use multiple indicators in conjunction with one another to make the most informed trading decisions possible.
Cons
First, the Piercing Line Pattern is not as reliable in an uptrend as it is in a downtrend. Second, the pattern can be drawn on multiple timeframes, making it difficult to find trade entries that fit your risk parameters.
Finally, false positives are common with this pattern, meaning that often it will signal a reversal when none is present. While the Piercing Line Pattern can be a helpful tool for traders, it is important to be aware of its limitations before using it as part of your trading strategy.
Engulfing Pattern
If the second candle closes above the first candle’s opening level, the piercing line pattern—a bullish reversal pattern—becomes a bullish engulfing pattern. When the real body of one candlestick completely engulfs the real body of the preceding candlestick, this is known as an engulfing pattern.
This pattern can occur with either bullish or bearish candles, but the meaning is very different depending on how the market moves. If an engulfer is followed by a candle of the opposite color, it usually signals a change in trend. For example, if there is a downtrend and a green candle engulfs a red candle, this would be considered a bullish reversal signal.
Alternatively, if an uptrend and a red candle Engulf a green candle, this would be considered a bearish reversal signal. There are many ways to trade engulfing patterns, but the most important thing is to ensure that you are using them in context with the overall market trends.
Piercing Line vs. Dark Cloud Cover
A piercing line is a bullish candlestick pattern that forms after a downtrend. It takes place when the open price of the preceding candlestick is lower than its closing price, yet the closing price of that candlestick is higher than its midpoint.
The formation of a Piercing Line indicates that the bears are about to lose control of the market and that the bulls are beginning to take charge. When the subsequent candlestick closes at a price that is even higher than the Piercing Line, the pattern has been confirmed.
A Dark Cloud Cover is a bearish candlestick pattern that forms after an uptrend. It happens when the open price is above the close price of the previous candlestick, but the close price is below the midpoint of the previous candlestick.
A dark cloud cover is a warning sign that the bulls are beginning to lose control of the market and that the bears are beginning to take charge. The pattern is confirmed when the next candlestick closes at a price that is even lower than the Dark Cloud Cover.
Ideal Trading Setup for Piercing Pattern
The ideal setup for trading a Piercing Pattern is when the market is in a clear downtrend, and the pattern forms near the bottom of the trend.
For the pattern to be valid, the candlestick that forms the pierced line should be a long bearish candlestick, and it should be followed by a bullish candlestick that closes at least halfway up the body of the previous candlestick.
The Piercing Pattern is a two-candlestick pattern, so it is important to confirm that the bullish candlestick closes higher than the midpoint of the bearish candlestick before taking a trade.
Once these conditions are met, traders can look to enter long at the opening of the next candle, with a stop placed below the low of the piercing candle and a target set at a level where the price has recently found resistance.
FAQs
Is Piercing Pattern Bullish?
The Piercing Pattern is a bullish candlestick pattern that appears after a period of selling pressure. The Piercing Line is typically seen as a bullish signal, indicating that buyers are willing to step in and buy after a period of pressure on selling.
What does Piercing Line Indicate?
A Piercing Line is an indicator used in technical analysis that suggests a reversal in the current trend. This signal is created when the price of an asset moves below a previous low, and is then followed by a period of consolidation before breaking above the high of the initial candlestick.
What Does a Thrusting Line Indicate About the Price of a Stock?
A thrusting line is a technical analysis indicator that occurs when the price of a stock makes a sharp move higher or lower, followed by a period of consolidation. Another sharp move then follows this move in the same direction. The trendline is created by connecting the lows (in an uptrend) or highs (in a downtrend).
A thrusting line is considered a strong bullish or bearish signal and often leads to a continued move in the same direction. It can also be used to identify support and resistance levels. When prices break out above or below the trendline, it can signify a trend change.
What Is a Bearish Piercing Pattern?
A bearish piercing pattern is a candlestick pattern that can predict bearish market conditions. The pattern consists of two candlesticks, the first of which is black and the second of which is white.
The white candlestick should close below the midpoint of the black candlestick’s body. The bearish piercing pattern can be found at the bottom of a downward trend, indicating that the bears are losing strength.
For the pattern to be valid, there should be some trading activity after the second candlestick is formed. If a strong bullish reversal follows the bearish piercing pattern, it can signal early that a bottom has been reached.