Understanding the Evening Star Pattern
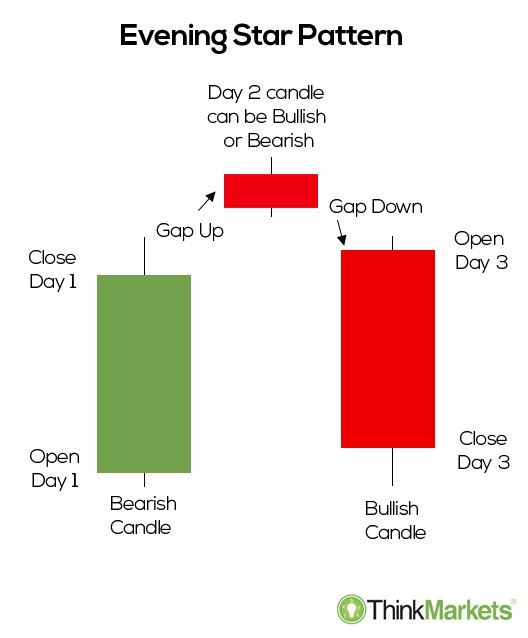
Evening Star is a bearish reversal candlestick that appears at the top of an uptrend and signals a potential change in momentum. The pattern is made up of three main candlesticks. The first one is a bullish candlestick that affirms the market is in an uptrend backed by bullish momentum.

The second one is a small-bodied candlestick that can be bearish or bullish but does not touch the body of the first candlestick. Finally, the third one is a large bearish candlestick that affirms the momentum shift from bullish to bearish.
How to Identify an Evening Star Pattern
A pattern is deemed Evening Star formation only if the following factors hold
- Price was initially in an uptrend making higher highs is with buyers in control.
- The first candlestick is a solid bullish candle affirming bulls in control.
- The second candle is a small candlestick with a short body and does not touch the body of the first.
- The third candlestick is a large bearish candlestick that opens below the second candlestick and closes slightly near the lows of the first candlestick.
Evening Star Market Psychology
The evening star pattern is considered a reliable bearish signal implying a downtrend is in play after a significant move to the upside. While the first candlestick implies the market is still in an uptrend with buyers in control, the second candlestick, which can be doji, means bulls are losing the impetus to push the price higher.

The fact that the opening and closing prices of the two candlesticks are close to one another resulting in a small real body for the candlestick, affirms waning buying momentum. The third candlestick opening below the second candlestick and closing below the middle of the first candlestick affirm bears have overpowered bulls and looking to send prices slower.
With trend reversal now confirmed, technical analysts use this opportunity to eye short positions as soon as the third candlestick closes and confirms the bearish reversal.
How to Trade the Evening Star Pattern
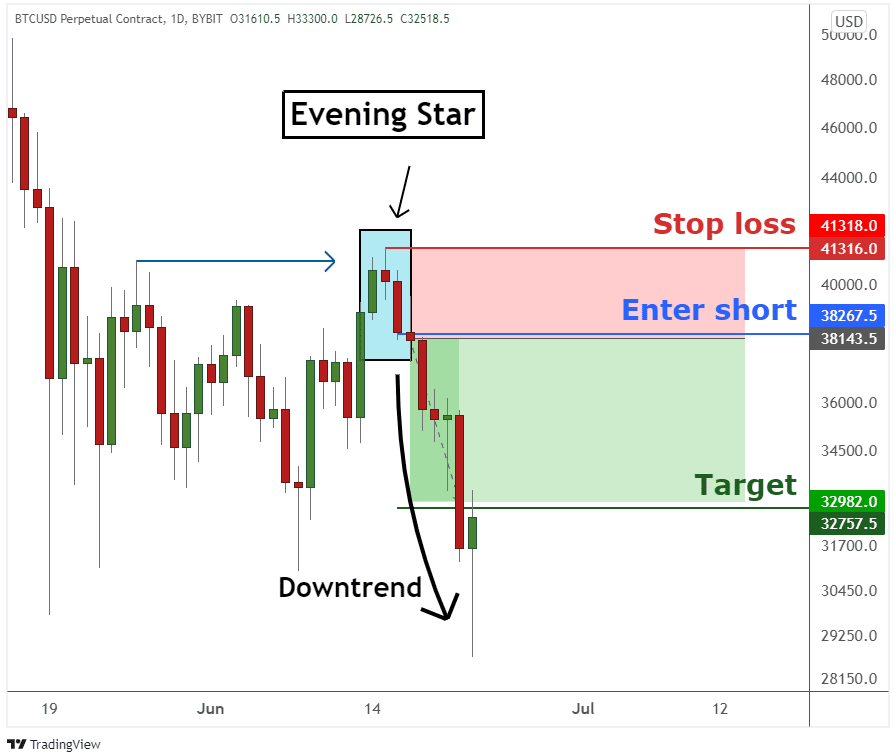
When it comes to trading the Evening Star pattern, it is important to identify areas of strong resistance where buyers are likely to experience strong opposition from short sellers.
In the BTCUSD chart above, it is clear that the price was uptrend until a buyer’s experienced strong resistance in trying to push it higher. The result was buyers holding firm and countering bears with success. The second candlestick moves slightly higher but ends up closing lower, affirming soaring short selling pressure.
The formation of a much bigger bearish candlestick that closes below the last bullish candlestick indicates bears are in control. With bears in control, prices are expected to tank in continuation of the long-term downtrend.
Once the evening star pattern emerges near a resistance level, bears often interpret it as a bearish reversal pattern and eye short selling positions as prices often end up tanking. Trades are opened on the close of the third candlestick with stop loss orders placed a few pips above the resistance level.
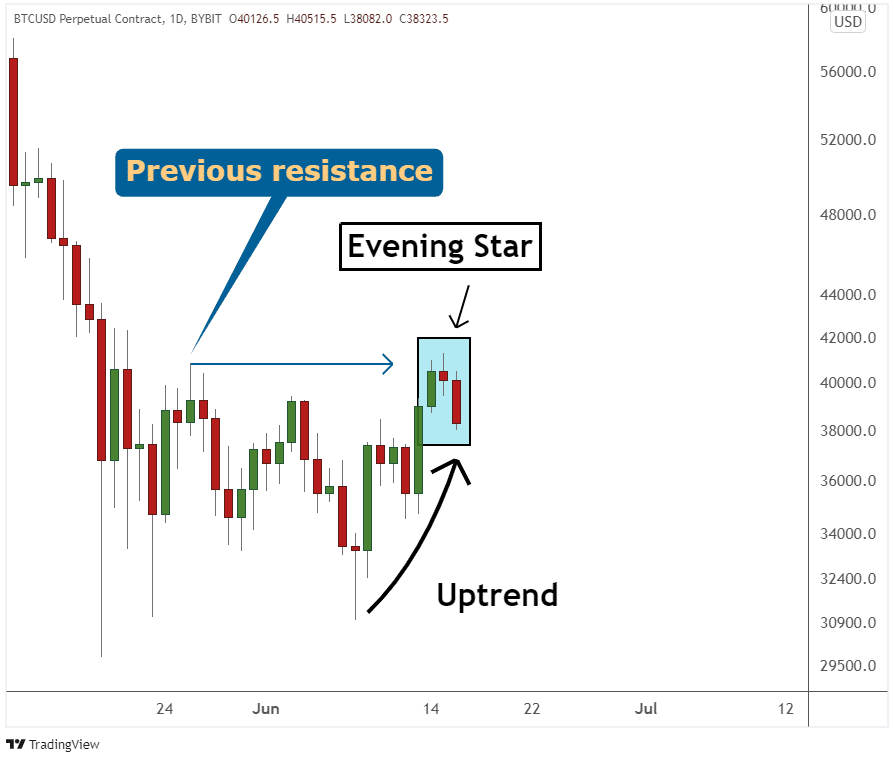
While the evening star is a popular trend reversal signal for short sellers, bulls also use it to exit the market and lock in profits after a significant move higher.
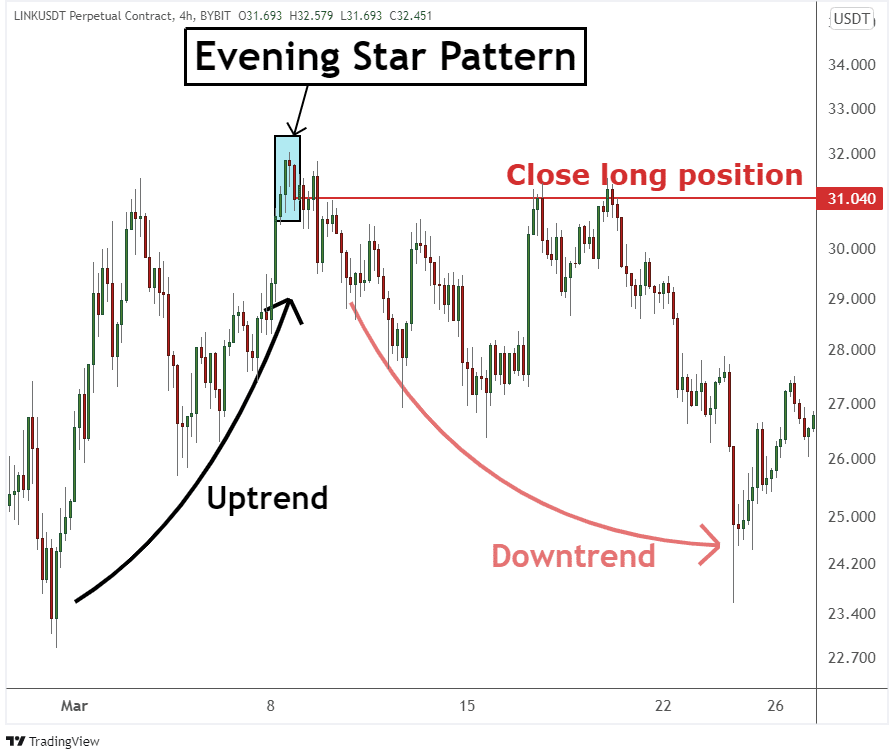
In the chart above, it is clear that prices were edging higher after the small pullback lower. However, after some time, the evening star pattern emerges at the top affirming waning upward momentum. Upon the closing of the third candlestick, affirming a shift in momentum from bullish to bearish, traders used the opportunity to close down all opened long positions.
By closing in the positions, buyers locked in profits accrued during the previous uptrend and averted the risk of breaking even or incurring significant losses on prices edging lower.
Evening Star with Moving Average
Moving averages are powerful technical analysis tools used to affirm the underlying trend. Whenever the price is above a given moving average, it indicates upward momentum. Likewise, whenever the price is below a given moving average, the same affirms a downtrend.
Similarly, the moving average provides valuable insights into strong resistance and support areas. For instance, whenever the price moves close to the moving average from below, only to get rejected and move lower affirms the MA as a strong resistance level. Similarly, whenever the price pulls back from an uptrend towards the moving average only to be rejected and bounce back, the same affirms the MA as a strong support level.
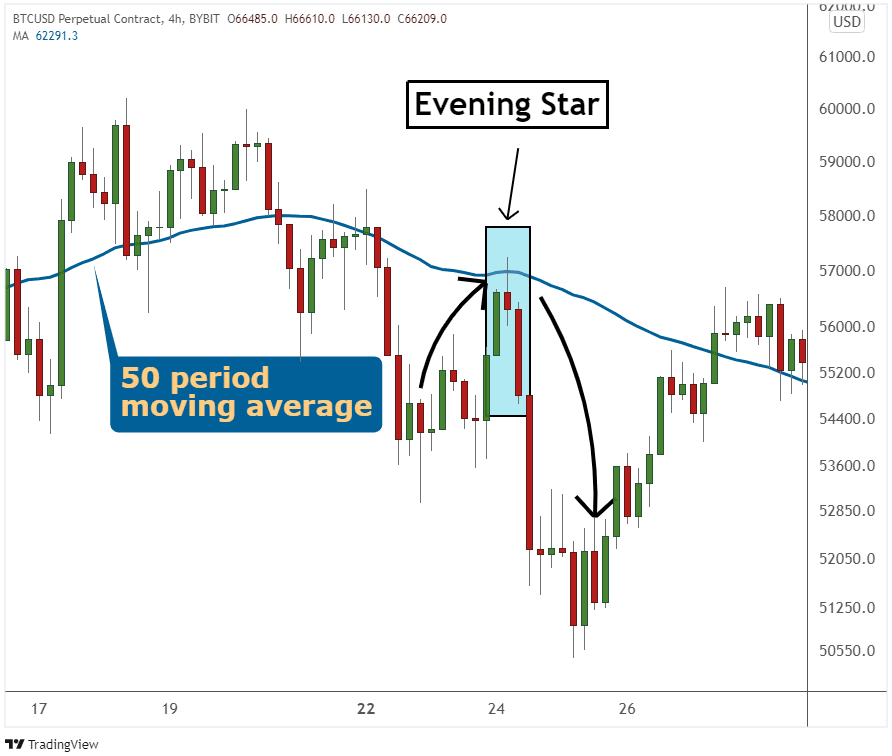
The chart above clearly shows that the 50-period moving average shows strong resistance areas. Price bouncing back to the MA only attracts short sellers who push it lower. The emergence of the Evening star close to the MA affirms the entry of short sellers into the market, pushing the price lower.
Evening Star Pattern and Relative Strength Index
The relative Strength Index is another common indicator commonly used to ascertain areas where the market is overbought or oversold. For instance, whenever the indicator reading is above 70, the underlying asset is considered overbought and likely to reverse the trend and start moving lower on buyers locking in profits and short sellers entering sell positions.
Similarly, whenever the readings are below 30, the underlying asset is considered oversold. The prospect of the underlying asset price bouncing back is usually high as short sellers exit the market to lock in profits and buyers enter the market to try and buy from the lows.
The Relative Strength Index is commonly used to predict areas where an Evening Star pattern is more reliable in signaling a bearish reversal. Whenever the pattern appears while the RSI readings are above 70, signaling overbought conditions, then the likelihood of the price changing course and moving lower is usually high.

In the chart above, the Relative Strength Index indicates that the GBPUSD pair is overbought. As the price peaked while the RSI indicated overbought conditions, the Evening Star emerged, affirming the prospect of a trend reversal from the top. Afterward, the price was corrected and edged lower as part of the bearish reversal pattern.
Afterward, the relative strength index starts edging lower, signaling a buildup in selling pressure. Price also tanks, affirming the sell-off from the uptrend.
Evening Star and Shooting star patterns
The Evening Star and Shooting Star patterns are almost the same. Both are bearish reversal candlestick patterns that occur after a significant price move. The only difference between the two patterns is in the second candlestick as part of the three candlestick patterns.
For the evening star, the second candlestick has a small real body, which affirms waning upward momentum. For the shooting, the second candlestick is usually a Doji candle. The Doji Candle indicates indecision at the peak of the uptrend.
The Doji does not in any way signal a reversal is about to happen. In most cases, the Doji candle indicates the market can go anywhere as buyers and sellers fight for supremacy. It is the third candlestick that provides a reliable signal on the direction the market is to go.
The emergence of a third large bearish signal affirms the shooting star pattern, signaling bears have overpowered bulls and are set to push prices higher.
In the chart above, the Doji candlestick appears at the top and is immediately followed by a large bearish candlestick that closes a few pips close to the lows of the first bullish candle as part of the shooting star formation.
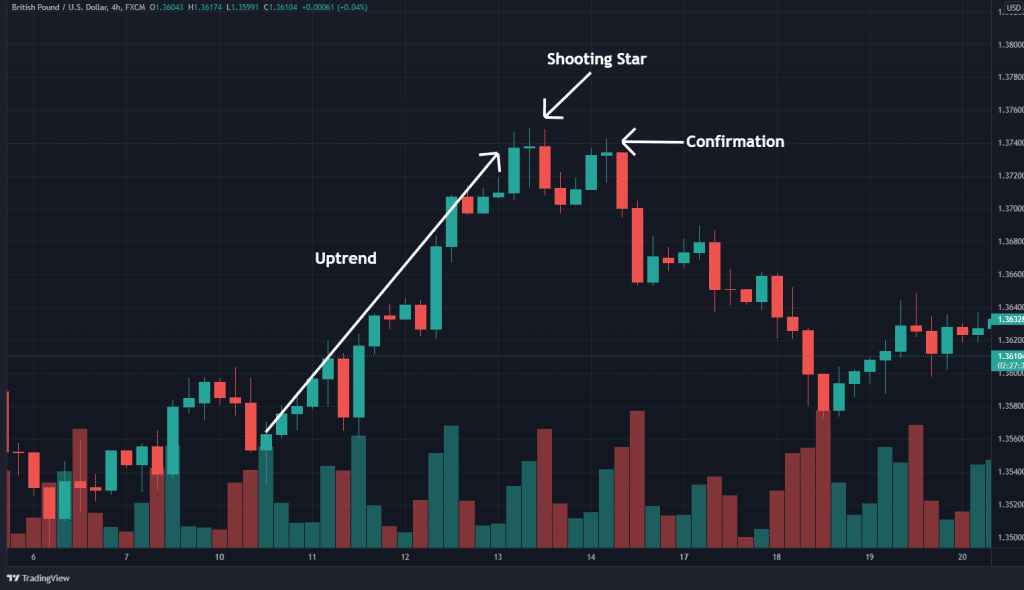
Afterward, the price tanked with the highs of the Doji candle, acting as a strong resistance level. Traders using this pattern to trade the reversal placed a short immediately after the bearish candlestick after the Doji candle closed with a stop loss placed a few pips above the highs of the Doji.
How reliable is the Evening Star Pattern
Evening Star is a reliable bearish reversal candlestick pattern with a success rate of about 70.2%. Its success rate in predicting bearish reversal is enhanced by using other technical indicators. For instance, when the pattern appears near a strong resistance level, there is always a strong likelihood that the price will correct from the previous uptrend and move lower. The resistance level tends to attract more sellers to join the fray and help lower prices.
Additionally, using moving averages to determine areas of strong resistance helps enhance the candlestick pattern’s ability to predict trend reversals. Whenever the price struggles to rise above a given moving average, it affirms an area of strong resistance. The emergence of the evening star pattern close to the moving average only confirms the start of a downtrend after a significant move higher.
However, it is essential to note that the frequently occurring evening star pattern might not provide accurate trading signals. Therefore, the prospect of a failed breakout is usually high. A failed evening Star breakout occurs when the pattern signals price is likely to tank, only to reverse and start moving up in the continuation of the long-term uptrend.
A failed breakout may occur if the evening star pattern occurs in a small volume. The insufficient volume needed to push prices lower could result in bulls re-entering the market and overpowering the bears in the process, thus pushing prices back up.
Morning Star
The opposite of the Evening Star pattern is the Morning Star pattern that occurs after the price has moved lower significantly. Consequently, the bullish reversal pattern indicates prices are likely to bottom out and move up as part of an emerging bullish trend.
The morning star pattern warns of weakness in the downtrend, signaling that the market is likely to bottom out. Just like the Evening star, it consists of three candlesticks. The first one is a long bearish candlestick that signals short sellers in control and likely to continue pushing prices lower as part of the downtrend.
The second candlestick is usually a small, bearish candlestick that affirms waning short-selling pressure. Finally, the third candle is the conformation candlestick. It is a large bullish candlestick with small wicks on both ends that closes close to the open of the first long bearish candlestick.
The large long bullish candlestick indicates bulls have overpowered short sellers and are poised to start pushing prices higher as part of the emerging uptrend. In addition, the morning star provides an accurate bullish reversal signal whenever it happens as the Relative Strength Index bounces back from oversold conditions and rises above the 30 level. The RSI rising affirms a shift in momentum from bearish to bullish.