Understanding the Hanging Man Candlestick Pattern
The single candlestick pattern belongs to the family of single candle formations and occurs when the price is in an uptrend. It is commonly referred to as a spinning top as the single candlestick comes with a small real body and a large wick or shadow. The candlestick has a short non-existent upper shadow and a long lower shadow.
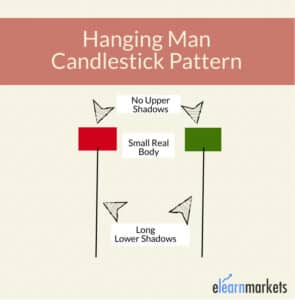
With the hanging man candlestick, the open is near the top, and so is the close, thus the small body. The candlestick’s real body is relatively small, given that the candlestick’s open and close price levels are close to each other.
Additionally, the candlestick will have a long lower shadow, three times the real body’s length. Likewise, the low and the high of the candle are at extreme ends. In addition, there may or may not be an upper shadow. If the shadow is there, it must be small.
Hanging Man Meaning
Trend reversals occur whenever the price has moved in a given direction for a long, and an opposing party enters the market and tries to change the price direction. The volatility swing that comes into play between buyers and sellers affirms indecisiveness in the market, acting as a potential change in underlying momentum.
If the counter force is strong enough and occurs in high volume, the likelihood of price changing direction from the underlying trend is usually high. The hanging man candlestick pattern is one pattern that affirms the seller’s footprint after a long bullish swing.
What Does Hanging Man Pattern Indicate
While the underlying trend doesn’t need to be bullish for the hanging candlestick to appear, there must be a price rise before the pattern appears and changes the price action direction. The pattern occurs when bulls are in control and try to push prices higher. However, bears gain dominance during the trading day or period and push the price lower.
Nevertheless, bulls regain control and push prices higher from the lows that bears had engineered. While they may succeed in making the price to close higher than the open, sometime, they might not. Therefore, the price ends up closing near the open.
In this case, the resulting candlestick will have a small real body as the close is near the open. Additionally, it will have a long wick or shadow indicating the lows that the bears have pushed the price to. The long shadow shows sellers stepped into the market at some time and tried to lower the price.
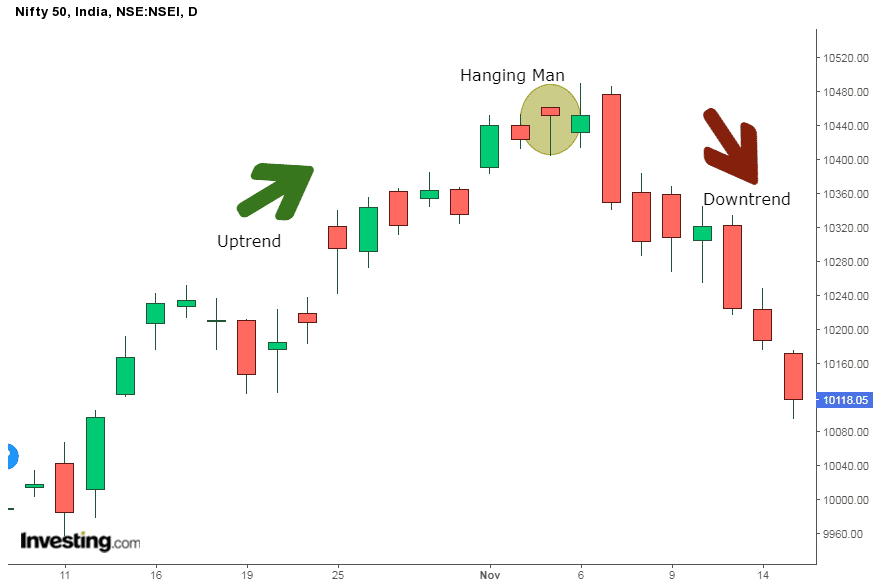
In the chart above, a hanging man candlestick emerges, signaling waning upward momentum. In the first trial, bulls try to push the price but fail as the bullish candlestick closes below the previous hanging Man candle.
While the bears did experience some pressure from bulls that came into the fold and tried to push the price higher, their presence indicates waning upward momentum as bears are becoming bold and trying to push the price lower.
The hanging man candlestick is confirmed by the next candlestick, which should be a strong bearish candlestick, affirming bears have regained control. Price gapping lower also asserts that momentum has changed from bullish to bearish.
What Does Hanging man Indicate
The hanging man is a bearish reversal candlestick pattern as it shows bears are increasingly fighting the bulls on price moving up significantly. While the reversal might not occur soon, the fact that the bears manage to push the price lower, resulting in the long wick in the single candlestick pattern, should be a warning sign of potential build-up in selling pressure after the price has risen significantly.
The appearance of the candlestick indicates the current bullish momentum is in the closing stages as the price is prepared to move lower as bears take the fight to the bulls. Conversely, once a more bearish candlestick emerges after the hanging man candlestick, it is interpreted that the market has reversed course and that price is likely to start moving lower.
Conditions for a Hanging Man
- The hanging man candlestick pattern is affirmed when the following conditions are met.
- The candlestick must have a small real body with an open near the close
- The lower shadow or wick must be at least twice the size of the candle’s body
- The candle must appear at the upper end of a trading range
- There should be a small or no upper shadow
Hanging man Candlestick Pattern Example
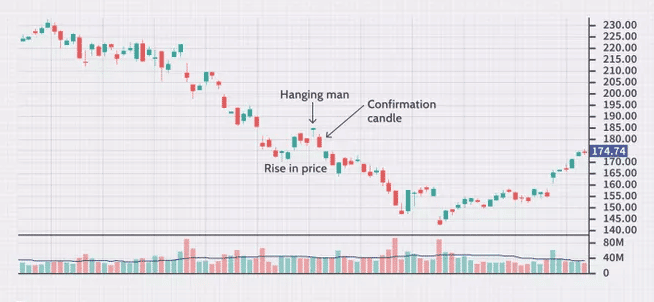
The chart above clearly shows that the price was moving lower. However, it hit strong support and bounced back as if to signal a start of an uptrend from the downtrend. Afterward, the emergence of a hanging man candlestick signals a potential shift in momentum as the emerging bullish momentum starts to fade.
Bulls struggle to push the price higher as the emergence of a more bearish confirmation candlestick affirms momentum shift. Once the bearish confirmation candlestick emerges, bears enter the market and push the price lower in continuation of the long-term downtrend.
The chart above shows that the hanging man does not have to come after a prolonged price advance. Instead, it can mark the end of a short-term rally within a long-term downtrend.
Hanging man candlestick in an uptrend
Combined with other indicators, the hanging man candle stick pattern provides reliable trading signals. In addition to waiting for a follow-up candle stick to confirm a price reversal, a moving average crossover could also affirm the prospect of price revising and moving lower.

The BTCUSD chart above clearly shows that the price is an uptrend in the first phase. However, a hanging man candlestick appears immediately after the price has moved up significantly and a strong bullish candle at the top.
The hanging man candlestick emergence signals the seller’s entry into the market and trying to push the price lower. The next candlestick is a small candlestick that fails to close above the hanging man affirming that bulls are under immense pressure from bulls.
The emergence of big bearish candlestick signals that the market has changed course and is likely to edge lower. The Moving Average Convergence and Divergence indicator crossover all but affirms that the momentum has changed from bullish to bearish on the fast-moving average, moving below the slow-moving average.
Hanging man candlestick limitations
One of the biggest limitations of the hanging man candlestick is that one cannot rely on it alone to predict a reversal is about to occur. Instead, one has to wait for a confirmation candlestick to affirm a change in momentum from bullish to bearish.
The candle that follows the hanging candlestick must be big bearish candlesticks to underscore bears have overpowered bulls. If there is no follow-up bearish candlestick, the price will likely increase to continue the underlying bullish trend.
In addition, the bearish confirmation candlestick must be supported by volume if the reversal holds. If the hanging man and the bearish confirmation candlestick occur in small volume, bulls might come into the fold and try to push the price higher after the small pullback.
Example Hanging Man and Moving Average Convergence
In most cases, the price is likely to move in tandem with the moving average such that both are close to one another. This is especially the case when using short-term moving averages such as 5 and 20EMAs. If there is a big gap between the two, then there is always the likelihood at some point for both to end up converging.
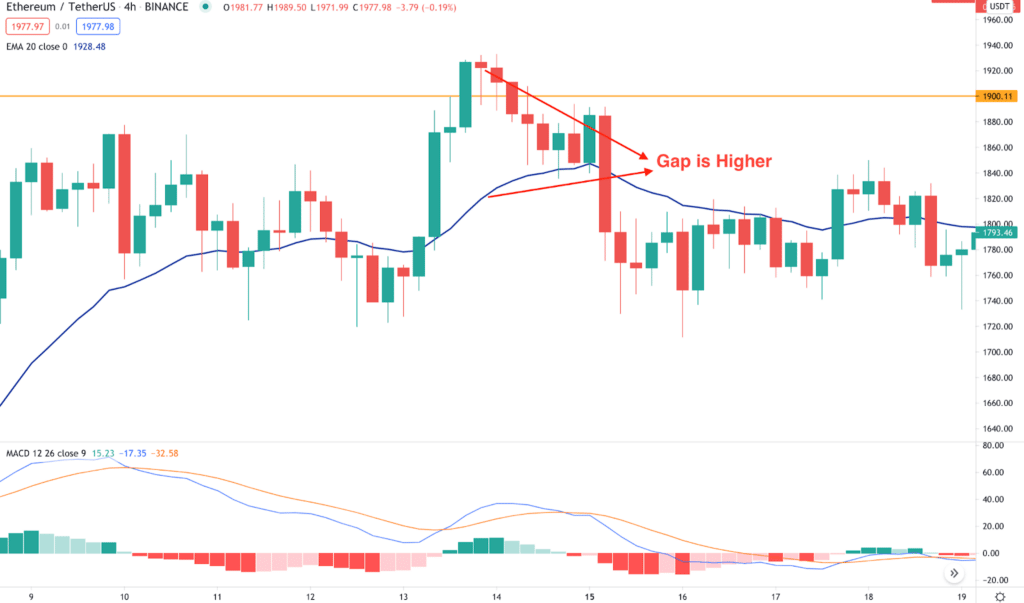
The chart above clearly shows that the price moved away from the 20EMA as it was moving higher. However, a price reversal was in play as soon as the hanging man pattern emerged, followed by a big bearish candlestick. Consequently, the price edged lower to the 20EMA.
Hanging Man Pattern Failure
Hanging man is not always accurate in predicting reversals. However, the pattern can provide a wrong signal if there is no follow-up candlestick to confirm that bears have indeed overpowered bulls and are likely to push prices lower.
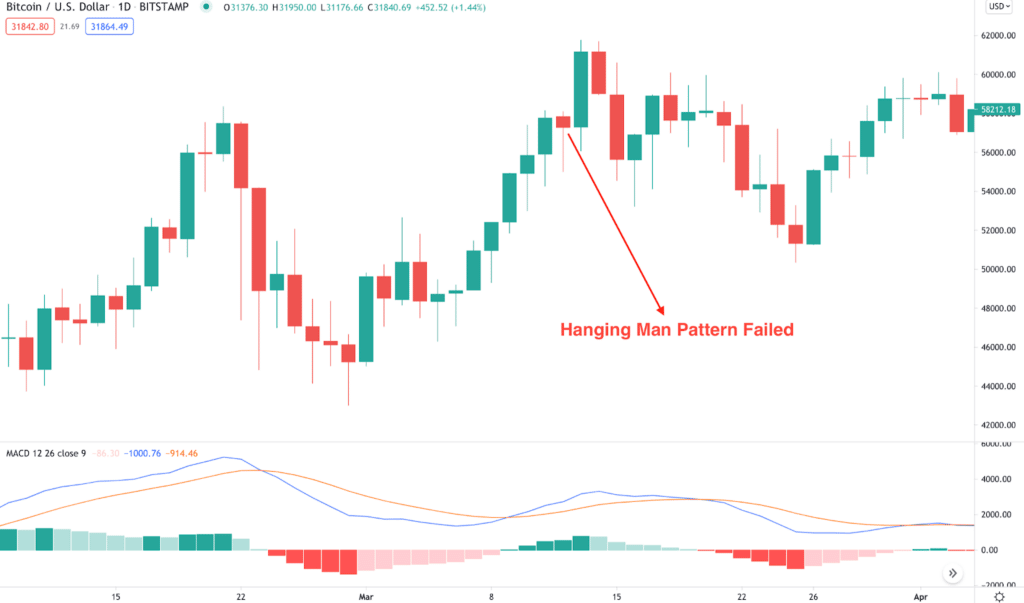
In the chart above, the hanging man, a pattern occurs as the price moves up as if to signal the seller’s entry into the market. However, the short sellers struggle to push the BTCUSD price lower as bulls come back into the fold and push the price higher above the initial high of the hanging man candle stick.
Therefore, for the whole trading of the hanging man candlestick, it is important to always place a stop loss order a few pips above the highs recorded by the hanging man candlestick.
Hanging Man vs. Hammer
The hanging man candlestick is somehow similar to the hammer in appearance. The only difference between the two is the context and where they are formed. The hammer is considered a bottoming pattern that occurs after the price has moved lower significantly.
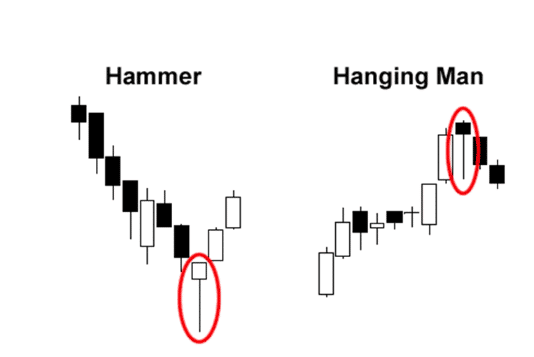
Therefore the hammer, in most cases, is a bullish reversal pattern that affirms the prospects of price correcting from a downtrend and starting to move up. While it shows strong selling during the period at the close, buyers regain control, resulting in higher prices closing.
In contrast, the hanging man appears at the top of an uptrend with buyers struggling to push prices higher. Therefore, it is a bearish reversal candlestick as, in most cases, it is followed by the price retreating and starting to move lower.
While the hammer occurs after the price has moved lower and warns of potentially higher prices to come, the hammer occurs after the price has moved lower and warns of potentially higher prices to come.
Hanging Man Success rate
While the hanging man is a reversal candlestick, it tends to occur most of the time, which limits its reliability in predicting potential price reversal. Its success rate in predicting price reversals stands at about 59%, which is quite low, especially for traders who want an edge when trying to profit from price reversals.
The prospect of the single candlestick pattern accurately predicting price reversal depends on the trader’s ability to be patient and wait for confirmation. The next candlestick after the pattern should be bearish enough to affirm that price has reversed course. In addition, the reversal should occur in high volume for the price to reverse course and move lower.