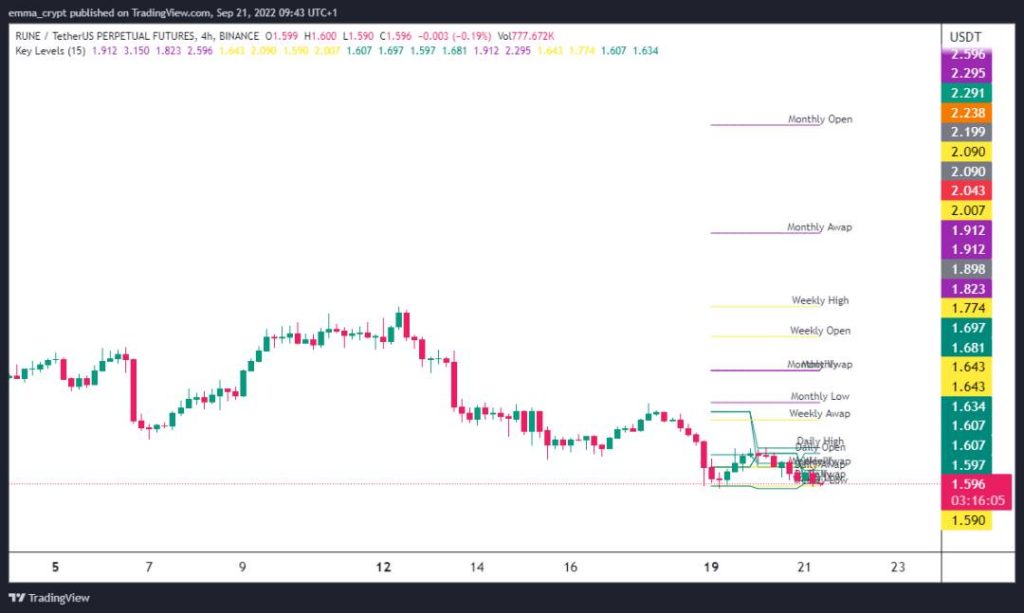
As a trader, you need always to be aware of key levels. Key levels are important price points that can influence the market. These are support and resistance levels that can have a big impact on the market. They can be used to enter or exit a trade, or to set stop losses and take profits.
In this post, we’ll look at key levels and how to use them in your trading. By understanding key levels, you’ll be able to make better trading decisions and improve your profitability.
What are Key Levels?
Key levels are horizontal price levels that act as support or resistance. They are created when the market consolidates after a period of extended bullish or bearish activity. In other words, key levels are areas where the market has difficulty moving past due to the opposing pressure from bulls and bears.
As a result, these levels often see a lot of price action as the market attempts to break through. Traders can use key levels to predict where the market will likely head next.
By identifying key levels, traders can enter or exit positions based on whether the market will continue moving in the same direction or reverse course. Key levels can be a valuable tool for any trader when combined with other technical indicators.
Types of Key Levels
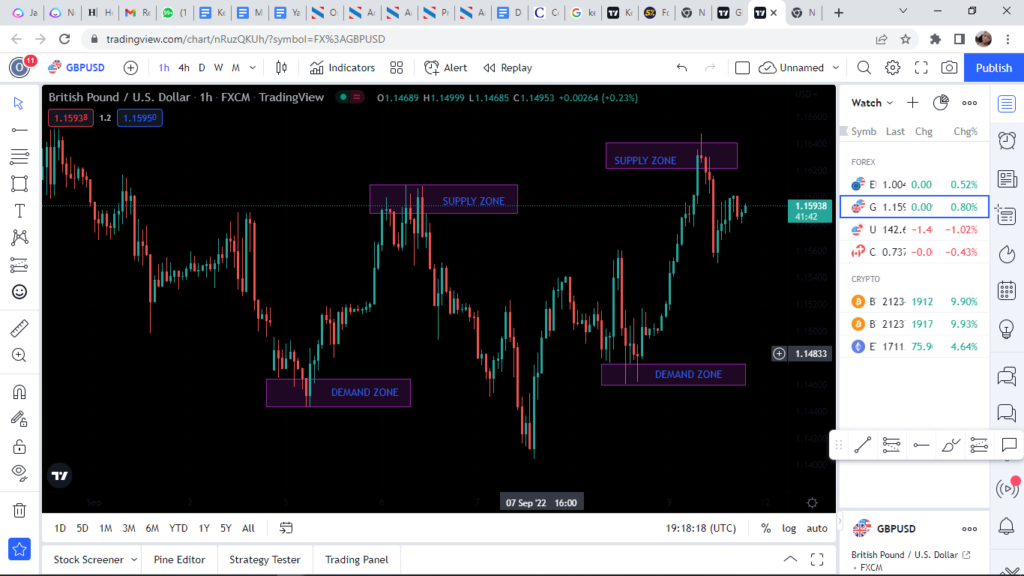
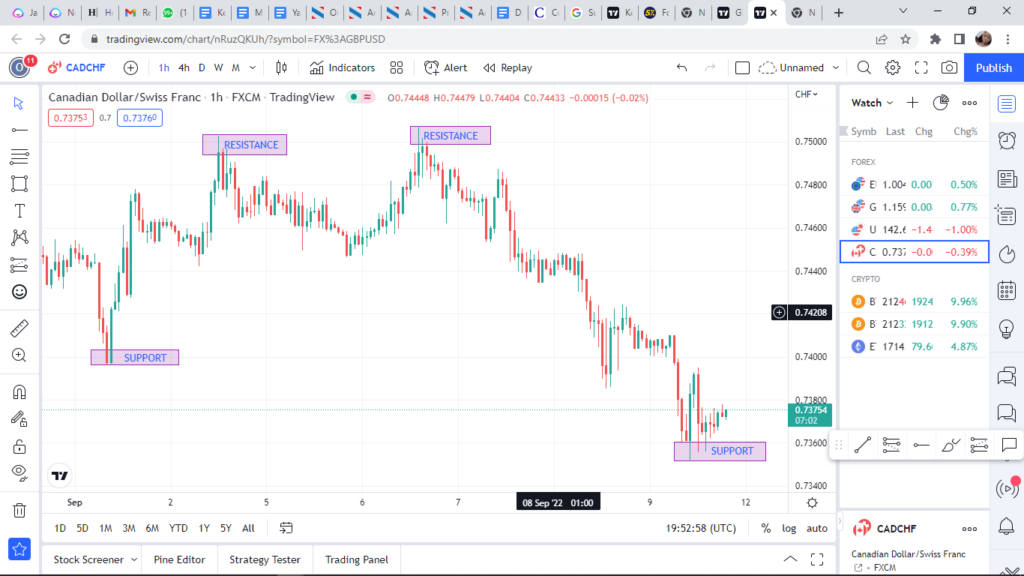
There are three main types of key levels: support, resistance, and pivot. Support and resistance levels are determined by analyzing past price action to identify where the market will likely find buying or selling pressure.
A support level is a price at which buyers are expected to step in and start buying, while a resistance level is a price at which sellers are expected to start selling.
A pivot level is a more technical level used to identify potential turning points in the market. Pivot levels are calculated using a combination of the previous day’s high, low, and close Prices.
Traders can use support and resistance levels to place orders or set stop losses. Pivot levels can be used to generate trading signals or as part of a system for setting profit targets.
The most important thing to remember about key levels is that they are not exact numbers but zones where the market is likely to increase buying or selling activity. It’s important to monitor how the market reacts around these key levels so you can adapt your trading strategy accordingly.
Types of Support and Resistance Key Levels

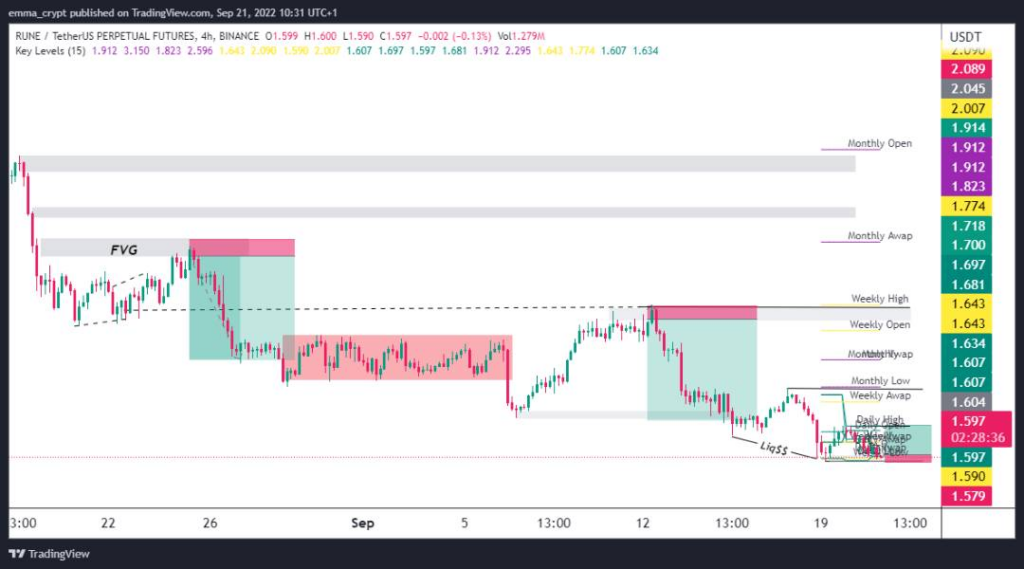
There are three main types of support and resistance key levels: horizontal, trendline, and dynamic. Each level type can be created using different methods and techniques, but all three are equally important in providing information about potential price movements.
Horizontal key levels are created by taking the highs and lows of past price action and drawing a horizontal line at those points. These levels provide information about possible future prices by indicating where buyers and sellers have been willing to enter or exit positions in the past.
Trendline key levels are created by connecting two or more high or low points on a price chart. These levels indicate possible future prices by showing the market’s overall direction.
Dynamic key levels are created using moving averages or other technical indicators to identify potential support and resistance areas.
These levels provide information about potential future prices by identifying areas where the market is likely to reverse direction. All three types of support and resistance key levels are important in providing information about potential future prices.
By understanding how each type of level is created, traders can make more informed decisions about when to enter and exit positions in the market.
How to Identify Key Levels
As any trader knows, correctly identifying key levels in the market is essential to success. There are a few different ways to approach this task, but some of the most popular methods involve support and resistance levels. These levels are created when the price of an asset fails to break through a certain level multiple times.
For example, if the price of an asset is bouncing off its $50 per share level for several days in a row, this level is likely acting as a support level. Once these levels are identified, traders can decide when to buy or sell.
Another method for identifying key levels is to use Fibonacci retracements. These levels are based on the market’s movements and can help traders predict where the price is likely to reverse course. By correctly identifying key levels, traders can increase their chances of making profitable trades.
How to Draw Key Levels
Here are three of the most important techniques for drawing key levels:
Big Bullish Candle
A big bullish candle is a candlestick with a large body and small wicks. It shows that buyers are in control and that prices will likely continue to increase. Look for big bullish candles formed at previous support levels when drawing key levels. These candles can be used to identify new support levels.
- Small Body Candle: A small candle is a candlestick with a small body and long wicks. It shows that neither buyers nor sellers are in control and that prices are likely to be volatile in the short term. When drawing key levels, look for small body candles that have formed at previous resistance levels. These candles can be used to identify new resistance levels.
- Big Bearish Candle: A big bearish candle is a candlestick with a large body and small wicks. It shows that sellers are in control and that prices will likely continue to move lower. When drawing key levels, look for big bearish candles that have formed at previous resistance levels. These candles can be used to identify new resistance levels.
How to Trade Key Levels
When it comes to trading, people use all sorts of different strategies. Some focus on technical indicators, while others use fundamental analysis. One approach that combines both technical and fundamental analysis is trading key levels. Key levels are areas where the price has strong support or resistance and can be used to enter or exit trades. Here’s a step-by-step guide to trading key levels:
- Look for an area where the price has bounced back and forth for a while. This indicates a strong level of support or resistance in the area.
- Wait for the price to break out of the range. This is your signal to enter a trade.
- Place your order at the key level and set your stop loss below or above, depending on your trading direction.
- Once the trade is triggered, you can either take profit at the next major level of support or resistance or hold the trade until it reverses and hits your stop loss.
Trading key levels can be a simple and effective way to trade the markets. By combining technical and fundamental analysis, you can ensure that you’re entering trades with a high probability of success.
Tips on Trading Key Levels
Trading key levels can be a great way to make money in the market. Here are a few tips to help you trade key levels:
- Look for key levels that have been tested multiple times. The more a level is tested, the more likely it is to hold.
- Make sure you know what kind of order you want to place before you enter the trade. If you’re unsure, it’s better to wait until you’re more certain.
- Keep your risk management in mind when trading key levels. You don’t want to risk too much of your account on any one trade.
- Be patient when trading key levels. If you don’t get filled right away, don’t worry – the level will likely be retested, and you’ll have another chance to enter the trade.
- Pay attention to price action around key levels. If the price consolidates near a level, it’s a good sign that the level is significant, and there’s a good chance it will hold.
By following these tips, you can trade key levels with confidence and improve your chances of success in the market.
How Do You Find The Key Level Of A Chart?
When you’re looking at a chart, the key level is the level that will give you the clearest picture of what’s going on with the asset. This level can be different for different people because everyone uses various indicators and has different preferences. However, a few general tips can help you find the key level for a particular chart.
First, take a look at the moving averages. These averages help smooth out the price action and give you a good idea of where the asset is headed in the long term. If the moving averages are trending up, the key level will likely be above the current price; if they’re trending down, the key level will be below the current price.
Secondly, check out the levels of support and resistance. These are points at which the asset has previously encountered resistance, and they provide clues as to when buyers and sellers might become active. If there’s a strong support or resistance level nearby, that’s probably the key level for the chart.
Finally, pay attention to news and earnings releases. These can greatly impact asset prices and can cause them to move sharply in one direction or another. If a major news event is coming up, that could be the key level for the chart.
By paying attention to these factors, you can get a good idea of the key level for any given chart. Once you know where it is, you can use that information to make better trading decisions.
FAQs
What Are Key Levels In Assets?
Key levels are important price points that can significantly impact asset prices. They can act as support or resistance, and they can be used to indicate buy or sell signals.
What are Trading Levels?
The fraction of the Portfolio’s net assets allocated to Tracking Assets stated as a percentage of the Portfolio’s net assets is referred to as the Trading Level.
The concept of the Trading Level is important for investors to understand, as it can impact the performance of their portfolios. A higher Trading Level indicates a more aggressive investment strategy, while a lower Trading Level means a more conservative approach. The Trading Level can lead to higher returns in bullish markets but more significant losses in bearish markets.
What Are Key Levels In Day Trading?
In day trading, there are key levels that traders watch. These levels can be based on support and resistance, Fibonacci retracements, or moving averages. Support and resistance levels are price points where the market has reversed direction in the past.
Fibonacci retracements are based on the Fibonacci sequence, and traders believe these levels can indicate areas where the market may reverse direction. Moving averages are lagging indicators that smooth out the price action and can help traders identify potential support or resistance areas.
Traders often use multiple technical indicators to identify key levels and may use different timeframes to find levels that align with their trading strategy. Day trading can be a complex endeavor, but paying attention to key levels can help traders find profits in the market.
What are Hot Keys in Trading?
In trading, hot keys are shortcuts that allow traders to quickly and easily enter or exit trades. For example, a trader might use a hot key to automatically place a buy order for an asset when it reaches a certain price.
Hot keys can be very helpful for busy traders who need to place orders quickly. However, they can also be dangerous if misused, as they can lead to accidental trades. Hot keys should therefore be used with caution and only by experienced traders familiar with the risks involved.
Conclusion
The three key levels in Forex we’ve looked at provide a strong foundation for your trading. Understanding how to use these levels can increase your chances of making successful trades and limit your risk when the market moves against you.