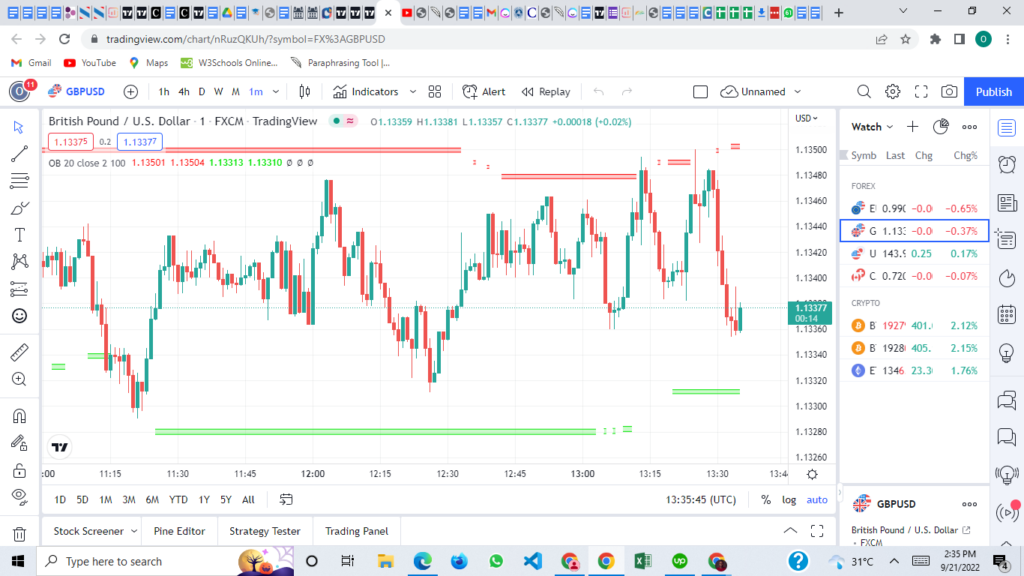
The Bollinger Bands indicator is used to measure volatility in the market. It consists of three lines: a center line and two outer bands. When the market becomes more volatile, the bands will widen; when the market becomes less volatile, the bands will contract.
This article will discuss using Bollinger Band Order Blocks for maximum profit and provide tips on getting the most out of this trading strategy.
History of Bollinger Band Order Blocks
Bollinger Band Order Blocks is a trading strategy that John Bollinger developed in the 1980s. Bollinger, who is a technical analyst, created Bollinger Bands as a way to measure market volatility.
Bollinger Bands are placed above and below a moving average, and their width varies based on the volatility of the underlying security. Bollinger Band Order Blocks is a strategy that takes advantage of this volatility by buying when the Bollinger Bands are far apart and selling when they start to converge.
The Bollinger Band Order Block strategy can be used on any timeframe, but it is most commonly used on daily charts. To implement the strategy, traders must calculate the Bollinger Bands for the desired security.
The Bollinger Bands can be calculated using various technical indicators, but the 20-day simple moving average (SMA) is the most popular indicator. Once the Bollinger Bands have been calculated, traders need to identify order blocks.
Order blocks are formed when the candlesticks bounce off of the upper Bollinger Band and then close below the middle Bollinger Band. Conversely, order blocks are formed when the candlesticks bounce off the lower Bollinger Band and then close above the middle Bollinger Band.
Once an order block has been identified, traders must place a buy order above the high of the candlestick that formed the order block. Conversely, traders will need to place a sell order below the low of the candlestick that formed the order block.
This trade’s stop-loss should be set at the outer edge of the Bollinger Bands. For instance, if you place a buy order above an order block, you should set your stop-loss level right below the lower Bollinger Band.
The target for this trade should be placed at previously identified levels of resistance or support. Bollinger Band Order Blocks is a simple yet effective trading strategy that can be used to trade various securities.
What are Bollinger Band Order Blocks?
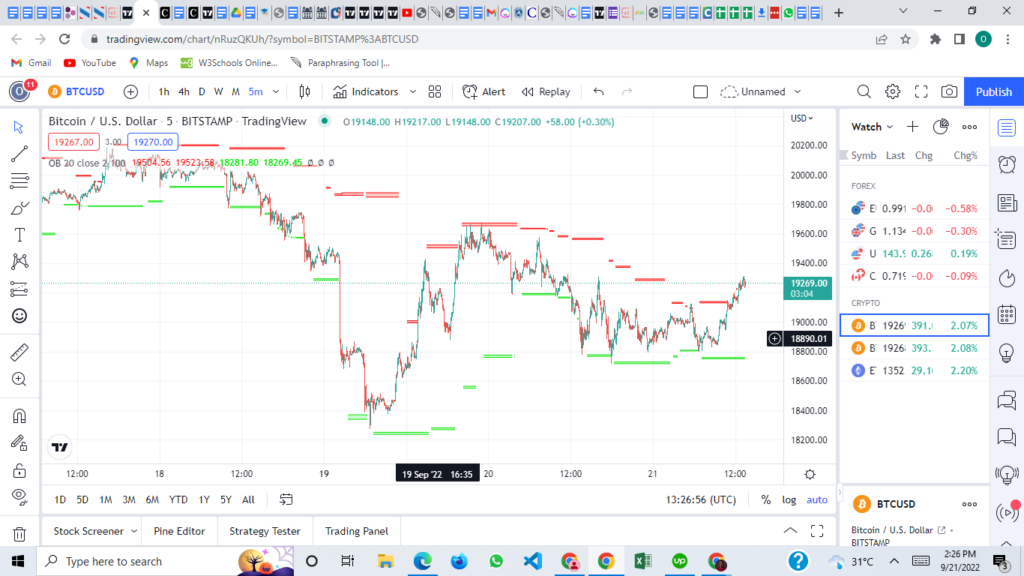
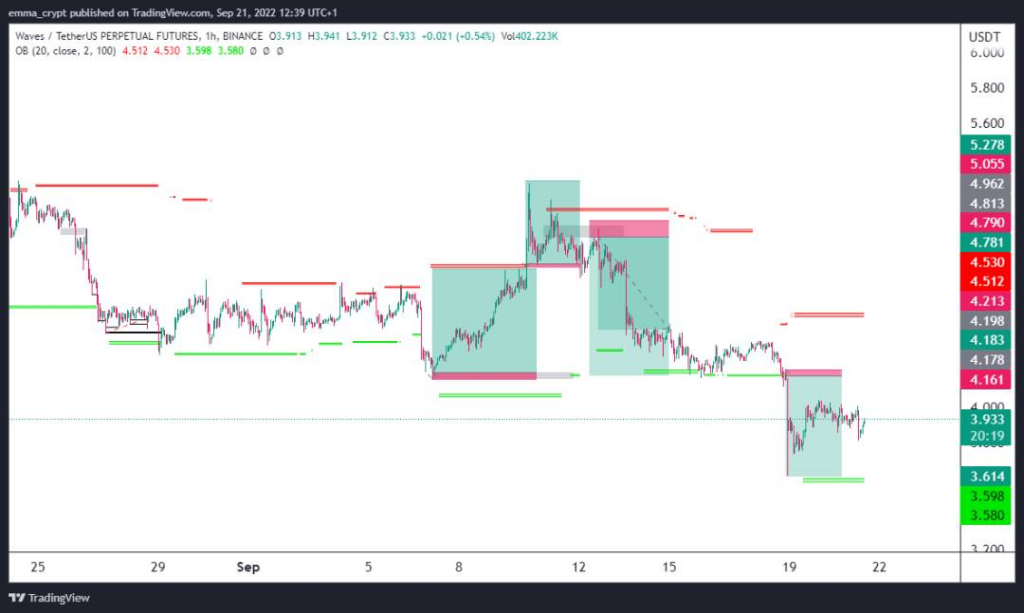
Bollinger Band Order Blocks are created when the price of an asset moves outside of the Bollinger Bands. These blocks can provide traders with a high degree of accuracy when making predictions about future price movements.
There are two types of Bollinger Band Order Blocks: buy orders and sell orders.
Buy orders are created when the price of an asset moves outside of the upper Bollinger Band and then returns inside of it. This indicates that there is potential for the price to continue moving higher.
Sell orders are created when the price of an asset moves outside of the lower Bollinger Band and then returns inside of it. This suggests that the price can continue trending downward in the future.
When placing trades, paying close attention to the order block size is essential. A significant order block implies a good chance that the price will move in the predicted direction. A small order block, on the other hand, may not be as reliable.
It is also important to note that Bollinger Band Order Blocks are not always 100% accurate. There will be times when the price does not move as predicted. However, by using this trading strategy, traders can increase their chances of making successful predictions and achieving maximum profits.
Now that we better understand Bollinger Band Order Blocks let’s look at how to use this trading strategy for maximum profit.
How to Use Bollinger Band Order Blocks for Maximum Profit
There are two main ways to use Bollinger Band Order Blocks: breakout trades and reversal trades.
Breakout trades occur when an asset’s price moves outside the Bollinger Bands and then continues to move in the same direction.
To identify a potential breakout trade, traders need to look for an asset’s price that is trading near the upper Bollinger Band. If the market conditions are favorable, then there is a possibility that the asset’s price will break out of the Bollinger Band and continue moving in the same direction.
When the price of an asset breaks outside the Bollinger Bands, reversal trades might occur because the price has now changed direction and is heading in the opposite direction.
Traders need to watch for an asset’s price that is trading around the lower Bollinger Band to determine whether or not there is a possibility of a reversal transaction.
If the conditions of the market are favorable, then there is a possibility that the price of the asset will move outside of the Bollinger Bands and begin moving in the other direction. This would indicate that the market conditions are favorable.
Both breakout trades and reversal trades have the potential to be profitable; however, it is crucial to be aware of the type of trade that is most likely to take place.
After analyzing the current market conditions, traders can look for potential Bollinger Band Order Blocks. It is essential to pay close attention to the size of the order block whenever one is placing transactions.
The presence of a large order block indicates the likelihood that the price will move in the anticipated direction. By using the Bollinger Bands indicator, traders can increase their chances of making successful predictions and achieving maximum profits.
Bollinger Band Order Block Pattern
Bollinger Band order block patterns are some of the most reliable reversal patterns you can use in trading. A Bollinger Band order block is a bullish or bearish candlestick pattern that forms within the Bollinger Bands. Bollinger Bands are a technical indicator that is used to measure market volatility.
They are composed of an upper Bollinger Band, a lower Bollinger Band, and a simple moving average in the middle. The Bollinger Bands expand when market volatility increases and contract when market volatility decreases. The Bollinger Bands order block patterns are considered reliable reversal patterns because they form at key turning points in the market.
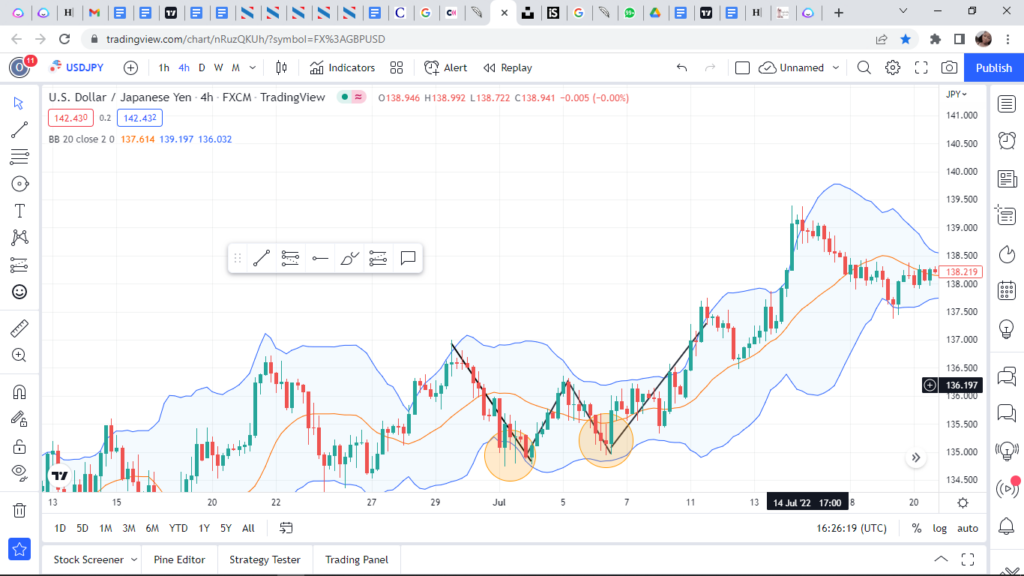
Double Bottom Pattern
The first Bollinger Band order block pattern is the double bottom pattern. This pattern forms when there are two successive lows within the Bollinger Bands. The second low must be lower than the first, but it does not have to be below the lower Bollinger Band.
This pattern is considered very bullish because it shows buyers are willing to step in and buy at lower prices. The double bottom pattern is considered complete when the price breaks above the highs of the two lows.
Reversal
The Bollinger Band Order Block trading strategy can also be used to trade reversals. A reversal occurs when the price action shows a series of higher lows followed by a higher high. This higher high creates the order block.
The Bollinger Bands expand as the price action creates higher lows, indicating that buying pressure is increasing. The price then bounces off the upper Bollinger Band and creates a reversal. This reversal is the sell signal. The stop loss is placed above the high of the order block. The target is the same as the sell signal.
Bollinger Band order block patterns are some of the most reliable reversal patterns you can use in trading.
These patterns form at key market turning points and provide valuable information about future market direction. If you want to maximize your profit potential, it is essential to understand how these patterns form and how to trade them effectively.
Using the Bollinger Band to mark areas of Support and Resistance
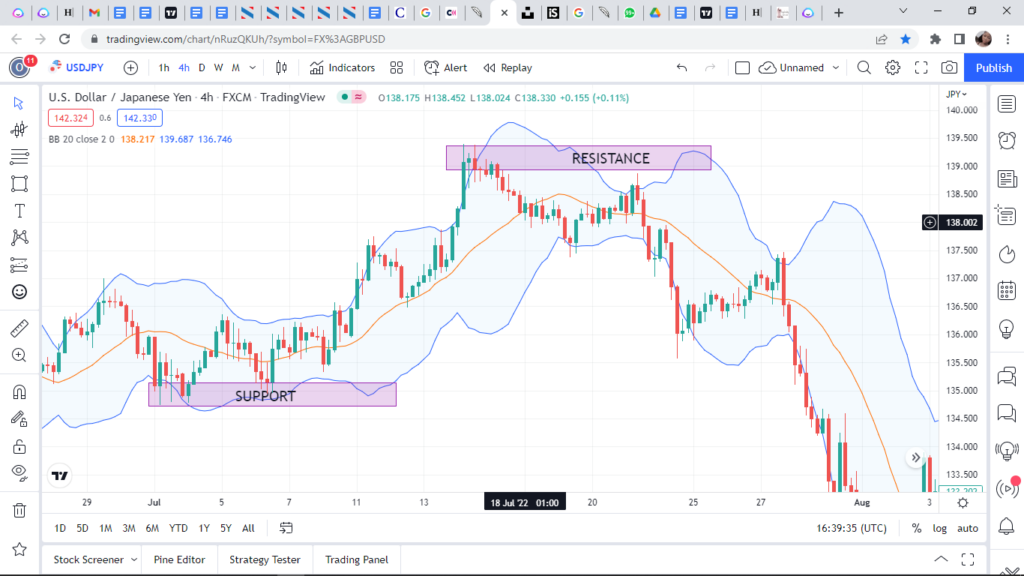
The Bollinger Band is a tool many traders use to help identify support and resistance areas. The Bollinger Band consists of two lines plotted with two standard deviations above and below a simple moving average. The Bollinger Band can mark areas where the price will likely find support or resistance.
The Bollinger Band marks areas of support and resistance by looking for instances where the price has touched the Bollinger Band and then reversed course. The script finds the highest and lowest levels of the bands to mark up future areas of interest.
The middle line of the Bollinger Band is often used as a moving average, and the upper and lower lines mark areas of resistance and support. Many traders use the Bollinger Band to identify areas where the price is likely to reverse.
The Bollinger Bands can be helpful for day trading and swing trading. When using the Bollinger Band for day trading, you will want to look for reversals at the upper and lower bands. You can use the Bollinger Bands to identify support and resistance areas for swing trading.
The Bollinger Band can also mark areas of support and resistance by looking for instances where the price has touched the Bollinger Band and then reversed course. The script finds the highest and lowest levels of the bands to mark up future areas of interest.
If the market conditions are favorable, then there is a possibility that the asset’s price will break out of the Bollinger Band and start moving in the opposite direction. If no new levels are found within the lookback range, the script will halt its plotting operations until new levels are discovered.
By using the Bollinger Band to mark areas of support and resistance, traders can increase their chances of making successful predictions and achieving maximum profits.
Limitations to Bollinger Band Order Blocks Strategy
Bollinger Band Order Blocks is a reliable trading strategy traders of all experience levels can use. However, like all trading strategies, Bollinger Band Order Blocks has its own set of limitations.
One of the significant limitations of Bollinger Band Order Blocks is that it does not consider the market’s order flow. The order flow is the net sum of all buy and sell orders in the market. Bollinger Band Order Blocks only consider the market’s price action, which means that it may give false signals in certain market conditions.
Another limitation of Bollinger Band Order Blocks is that it is based on a static market model. This means it does not adapt to changes in market conditions like other dynamic trading strategies. Despite these limitations, Bollinger Band Order Blocks are still helpful for traders who want to improve their results.
Tips on Getting the Most out of This Trading Strategy
Bollinger Band Order Blocks is a great trading strategy for anyone looking to get the most out of their trades. Here are a few tips on how to use this strategy for maximum profit:
- Always place your orders at the start of the Bollinger Band range.
- It is essential to change the band length. Changing the band length to levels 20, 50, 100, or 200 gives exciting results.
- Change the standard deviation multiplier. Changing the standard deviation multiplier to 3 instead of 2 marks up key levels.
- Take note of the lookback range. The lookback range shows better levels on 50, 100, and 200.
- Be patient and wait for the price to move toward your target.
- Take profit when the price reaches the top or bottom of the Bollinger Band range.
- Test your Bollinger Band Order Blocks strategy on a demo account before using it with real money.
Following these tips can maximize your chances of success with this powerful trading strategy. So, don’t wait any longer; start using Bollinger Band Order Blocks today and make some serious profits!
Final Thoughts
Bollinger Band Order Blocks are a valuable tool that can be used to predict future price movements. By using this trading strategy, traders can increase their chances of making successful predictions and achieving maximum profits.
However, it is essential to remember that Bollinger Band Order Blocks are not always 100% accurate. There will be times when the price does not move as predicted. However, by using this trading strategy, traders can increase their chances of making successful predictions and achieving maximum profits.
If you’re looking to become a more successful trader, consider using Bollinger Band Order Blocks to help you make predictions about future price movements. With a bit of practice, you’ll be able to use this trading strategy to your advantage and maximize your profits.
Read more:
- A Basic Guide to the On-Balance Volume Indicator
- Aroon Indicator and Its Technicalities
- What is the RSI in trading, And how to trade on it?
- Average True Range – A Basic Guide to trade this indicator
- Pi cycle indicator – Best Top and Bottom (Tried and Tested)
- Average Directional Movement Index (ADX)
- Bollinger Bands
- The Parabolic SAR
- What is Standard Deviation?
- Heiken Ashi Indicator
- Ichimoku Indicator
- Random Walk Index in Trading
- 5 Fibonacci Retracement Mistakes To Avoid At All Times

