Stochastic Indicator
A stochastic indicator is an oscillator that predicts potential trend reversal areas. It comes with readings of between 0 and 100. Readings of above 80 signal overbought conditions, implying bulls have bought the underlying instrument too much.
Overbought conditions kick in during increased buying pressure, where prices increase significantly to levels where few buyers are willing to buy. Consequently, when the Stochastic indicator reading rises above the 80-level, savvy traders tend to exit the market and lock in profit. The prospect of price reversal occurring at this level is usually high as buyers leave the market and short sellers use the opportunity to sell high.

Likewise, whenever the Stochastic indicators readings tank below 20, they imply oversold conditions, implying short sellers have sold the instrument too much. Oversold conditions kick in during increasing selling pressure, whereby an instrument under study plunges significantly.
The result is the price plunging to levels where short sellers are no longer willing to sell. The waning short selling pressure attracts buyers into the fold who attempt to buy at the new lows. Consequently, the prospect of price reversing from the downtrend when deep in the oversold territory is usually high.
Additionally, whenever the Stochastic readings rise from below the oversold territory resulting in readings above 50, it implies a buildup in buying pressure. Similarly, whenever the Stochastic readings tank from overbought conditions to below the 50-level, it confirms increasing selling pressure affirming the downtrend.
In the Sola Fide Trading strategy, the Stochastic indicator identifies areas of potential price reversal. When the stochastic signals overbought conditions, traders await price reversal from the uptrend to the downtrend. Consequently, this is a signal for exploring sell positions.
When the Stochastic indicator signals oversold conditions implying potential price reversal to the upside, traders should look for buy positions as the price could bounce back.
Choppiness Index
Choppiness Index is a volatility indicator that ascertains whether the market is trending or choppy, moving sideways. While stochastic does not provide valuable information on future market direction, it gauges the state of the current trend even though it lags.
The technical indicator has readings of between 0 and 100. When used in technical analysis, the closer the value is to 100, the choppiness the underlying instrument is or moving sideways.
Choppiness Index readings of more than 60 are associated with range-bound markets, affirming the financial instrument under study is not trending but moving sideways.
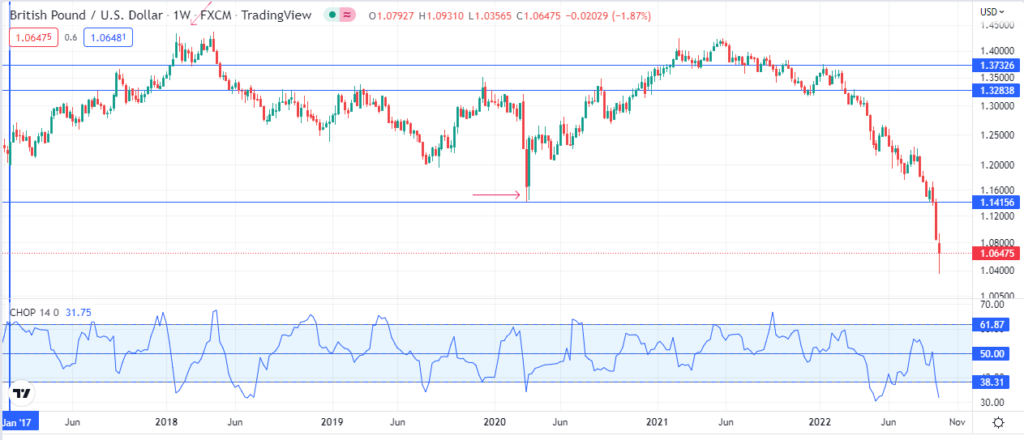
On the other hand, the closer the Choppiness Index readings are to zero, the stronger the market is trending. Consequently, readings below 40 imply the market is trending on the upside or the downside.
While the Choppiness Index helps confirm the prevailing market conditions, the technical indicator is also an essential tool for anticipating changes in the market’s trendiness. Consequently, extended periods of consolidation whereby the Choppiness Index continues to make higher highs should indicate an extended period or trend early.
In the Sola Fide Strategy, the Choppiness index provides valuable insight on when to expect strong trends after a period of consolidation. Consequently, the technical indicator prepares traders to enter long or short positions to take advantage of solid price moves to the upside or downside.
Relative Strength Index
The Relative Strength Index shares the same attributes as the stochastic indicator and confirms periods when the underlying instrument is sold or bought too much. It also comes with readings of between 0 and 100.
When the RSI readings are above 70, they signal an oversold condition as an early warning sign of potential price reversal as bulls lock in profit and short sellers try to sell high.
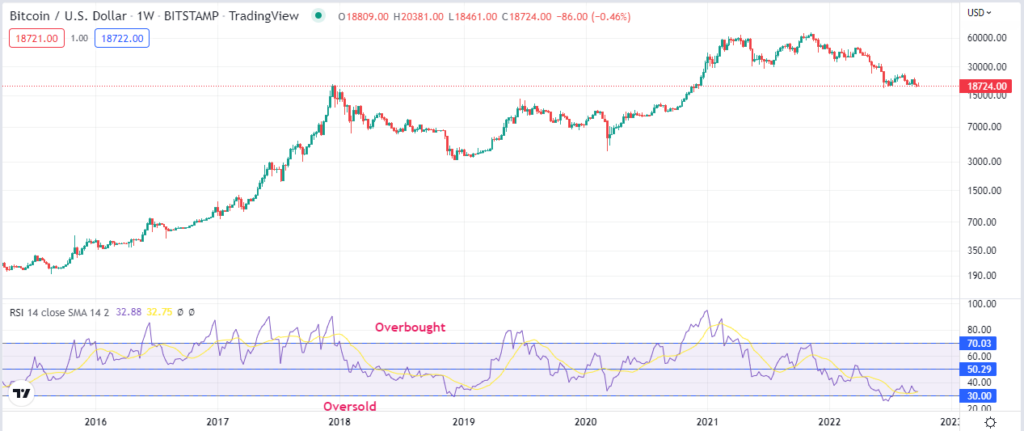
When the RSI readings plunge below 30, they signal oversold conditions implying short sellers have sold the underlying instrument too much. Consequently, short selling pressure tends to wane as short sellers exit the market to lock in profits, presenting an opportunity for bulls to enter the market. Buyers flocking to take advantage of the low price often causes price reversal resulting in price reversing from the downtrend to the uptrend.
In addition to confirming oversold and overbought conditions, the RSI indicator can confirm the prevailing market trend. For example, in the Sola Fide Strategy, whenever the RSI indicator rises from an oversold condition below the 30-level and powers through the 50-level, it confirms an emerging uptrend. Consequently, the underlying asset is considered trending upwards, presenting traders with an opportunity to see long or buy positions.
On the other hand, whenever the RSI tanks from the overbought level of above 70 to below the 50-level, it implies a momentum shift from bullish to bearish. Consequently, the underlying instrument is considered in a downtrend, presenting an opportunity for short sellers to eye short or sell positions.
The ATR Indicator
The average True Range is another volatility indicator that provides valuable insights into the strength of the underlying trend. It shows how much an asset moves on average during a given period. While the indicator does not indicate the price direction, it allows technical analysts to predict an asset’s volatility accurately.
The technical indicator moves up and down as the price moves. An expanding ATR affirms increasing market volatility. Consequently, whenever the ATR line is steep in the chart, it confirms high market volatility signaling strong price movements to the downside or upside.
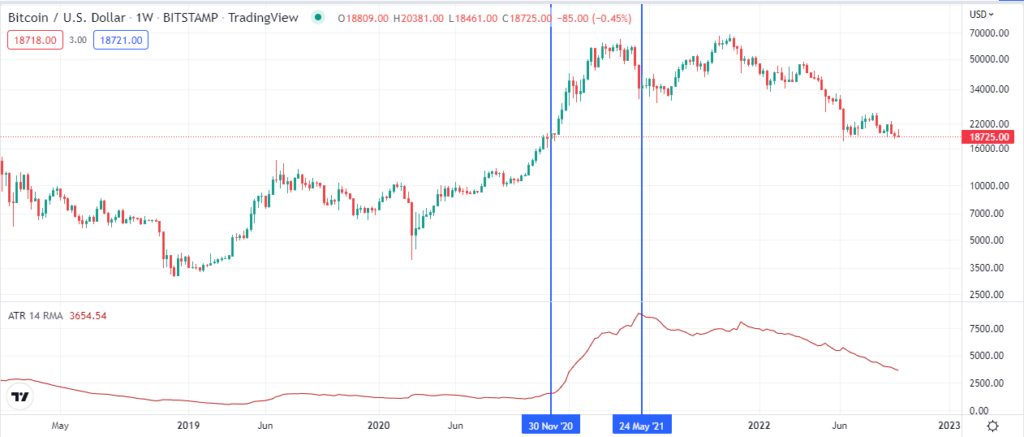
Given that the ATR indicator is bi-direction, whenever the price is plunging at high speed on high volume, the ATR indicator will also expand, and its chart will be steep. Similarly, if the price increases at a high rate due to high volatility, the ATR will also expand and be vertical in the chart.
A low ATR value or sideways movement affirms a range-bound market with no substantial volume for fuel-strong price movement. The lower volatility sees the price moving in a range without making any new highs or lows.
The ATR indicator also shows the exact level to place a trailing stop loss order. A trailing stop loss order allows one to exit a trade if the asset price moves against it and the exit point if the price moves in favor.
While trading, the focus is usually on the ATR reading. One can multiply the ATR reading by two to determine the reasonable stop loss point. Therefore, the stop loss should be placed at a level twice the chart below the entry price. If you are shorting the market, the trailing stop loss is to be placed twice the ATR reading above, the entry-level.
The Ichimoku Cloud Indicator
Ichimoku Cloud Indicator is a technical indicator that tells everything about the prevailing price trends, from momentum to direction and volatility. It also shows an area of strong support and resistance and potential reversal points.
The indicator comes with five main components.
Tenken Sen is a 9-day moving average that responds rapidly to price changes. It also acts as the first line of support when prices are moving up and the first line of resistance when prices are moving down.
Kijun Sen is a 26-day moving average that moves slower and responds slowly to price changes. It acts as the second layer of support when the price is trending up and the second line of resistance when it is trending lower. Whenever the Kijun is flat, it indicates the market consolidates.

Chikou Span is a lagging indicator that plots the closing price 26 periods back. While trading, the tool should not face any obstruction from candlesticks or Kumo clouds. It should always be free to move in any direction. When prices are increasing, they also trend up and fall when the price is dropping.
Senkou Span A is a leading indicator that is plotted 26 periods ahead. It stands along with prices and does not remain flat.
Senkou Span B is calculated using the midpoint of the last 56 periods. While it takes a long period to calculate, it is flat most of the time.
Cloud Kumo: It is the cloud that appears as part of the Ichimoku Cloud Indicator and acts as the gap between Senkou A and Senkou B. Whenever Senkou A is above Senkou B, it implies bullish Kumo signaling the prospects of a price increase. On the other hand, when Senkou A is below Senkou B, it affirms a downtrend confirming the possibility of price decline.
Trading Strategy Using Ichimoku Cloud
Buy Trading Strategy
Prices are considered to be in an uptrend, and time to enter buy positions when:
- Prices are above Tenken Sen and Kijun Sen, with both moving up
- Both Tenken and Kijun should move upwards along with prices
- Price should not be far from Tenken
- Prices should be above Kumo Cloud
Sell Trading Strategy
- Price should be below Tenken, and Tenken should be below Kijun
- Both Tenken and Kijun should move downwards along with prices
- Kumo cloud should be bearish
- Prices should be below Kumo Cloud
The Sola Fide Strategy
The Sola Fide Trading Strategy combines all the indicators to ascertain price action and the direction price is likely to move.
Sola Fide Strategy: Buy Position Conditions
Traders can look to go long or open buy positions when:
- The Stochastic indicator is pointing up or above 50, signaling the market is in an uptrend
- The RSI indicator should be pointing up and moving above the 50 level
- The Choppiness index should be pointing lower and dropping below the 50 level
- Tenken should be above Kijun in the Ichimoku indicator
- Price should be above the Tenken and Kijun Indicator
- The Kumo cloud of the Ichimoku cloud should be bullish and price above it
Sola Fide Strategy: Sell Position Conditions
Traders can look to enter short positions when:
- The Stochastic indicator points lower or below 50, signaling the market is in a downtrend.
- The RSI indicator should be pointing lower and moving below the 50 level
- The Choppiness index should be pointing lower and dropping below the 50 level
- Tenken should be below Kijun in the Ichimoku indicator
- Price should be below the Tenken and Kijun Indicator
- The Kumo cloud of the Ichimoku cloud should be bearish, and the price below it
Sola Fide Strategy Example
The chart below shows the ETHUSD price action chart with the Ichimoku indicator and stochastic and Choppiness Index indicators at the bottom.
Buy/ Long Set-Up
In the chart, it is clear that between August and October 2020, Ethereum was moving sideways even though the price was above the Tenken and the Kijun of the Ichimoku cloud. The Stochastic indicator was also flat around the 50-level area during this period. The Choppiness index was also trending up, affirming it was not the right time to trigger a buy position.
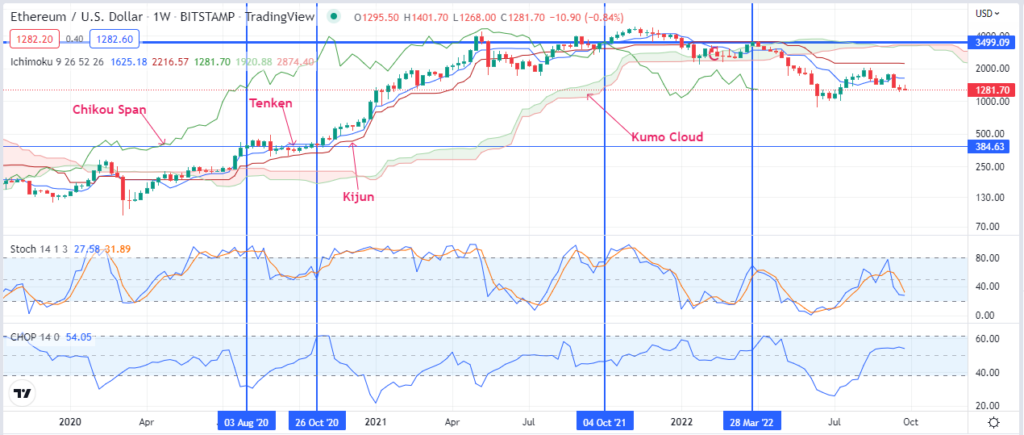
However, after October 26, the Choppiness index started trending lower, signaling a buildup in upward momentum. With the Stochastic indicator above the 50-level, it is clear that bulls were in control, presenting an opportunity to look out for buy positions.
The fact that the price was also above the Kumo cloud and the Tenken and Kijun indicator confirmed that the momentum was to the upside. Therefore, any pullback in price to the Tenken provided an ideal opportunity to enter a long position as the rate increased with the Choppiness index moving lower.
Short/Sell Set up
ETHUSD continued to edge higher from the end of October 2020 to about July 2021 when oversold conditions kicked in, as depicted with the stochastic indicator rising above the 80 level
A clear indication that upward momentum was waning is the Chikou Span moving below the price around October 21. The drop affirmed the momentum shift from bullish to bearish. Price also moved closer to the Kumo cloud signaling waning upward momentum with short sellers looking to push price slower.
Around March 28, 2022, the Tenken indicator moved below the Kijun indicator confirming the momentum shift from bullish to bearish. In addition, the Stochastic was also pointing lower, signaling it was time to look for sell positions.
The choppiness index starting to retreat from the 60-level confirmed that the downward momentum was building up, acting as an ideal signal to look too short or sell the market.
Bottom Line
The Sola Fide Strategy is an effective trading strategy for anyone looking to gain valuable insight into prevailing price action to confirm entry and exit levels. Using the stochastic, RSI, Ichimoku cloud ATR, and choppiness index make it easy to make informed decisions on price determination.