The Relative Strength Index
The Relative Strength Index is a momentum indicator that asserts the prevailing market condition. While the technical indicator has readings of between 1 and 100, anything above 70 implies overbought market conditions. In this case, the underlying asset is considered bought too much.
While there is usually the possibility of an asset price increasing as buyers continue buying even with the overbought conditions, prices tend to reverse in most cases. Once overbought conditions kick in, intelligent investors tend to exit by locking in profits resulting in trend reversal from uptrend to downtrend.
Likewise, any RSI reading below 30 implies oversold conditions signaling that the underlying asset is sold too much. While there is usually the likelihood of the asset price continuing to drop even with the oversold conditions in play, in most cases, the price tends reverse course and bounce back. The reversal comes as short sellers exit the market by significantly taking profits on price tanking and buyers using the opportunity to buy low.
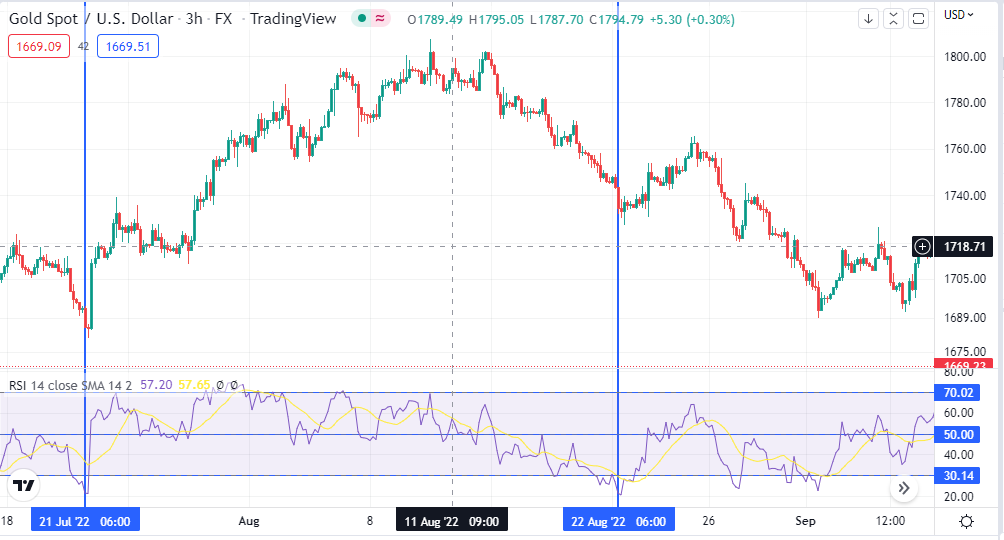
The gold price action chart above clearly shows that a bounce back always followed whenever the price fell, resulting in the RSI indicator plunging below the 30-level, confirming oversold conditions. Then, with the RSI in oversold territory, the price reversed course and edged higher afterward. Likewise, whenever the RSI reading rose above the 70-level, the price also changed course after some time and started edging lower.
Additionally, whenever the RSI reading starts rising from the oversold condition and moves above the 50 level, it affirms a change in market momentum from bearish to bullish. Therefore, as the RSI readings increase above 50, underlying asset prices will likely continue growing. For example, the chart above shows that gold prices increased as RSI moved from oversold to above the 50-line.
In addition, whenever the RSI reading starts tanking from the overbought condition and moves below the 50-level, it implies a shift in market momentum from bullish to bearish. It simply means bears have overpowered bulls and are likely to push prices lower. Gold prices edged lower as the RSI readings moved from the overbought level above 70 to below 50.
How to use the RSI indicator?
While the RSI indicator is commonly used to identify whether the market is oversold or overbought, it can also be used as a trend indicator. Consequently, whenever the RSI readings increase and rise above 50, it affirms a build-up in bullish momentum, signaling it might be the best time to enter long positions.
Likewise, if the RSI readings decrease from overbought levels and tank below the 50-level, they imply a build-up in selling pressure. Consequently, traders can use the opportunity to enter sell positions.
Stochastic Indicator
The stochastic indicator shares the same attributes as the Relative Strength Index and comes with readings of between 1 and 100. Whenever the stochastic indicator readings tank below 20, they imply oversold conditions suggesting the underlying asset has been sold too much.
During oversold conditions, the market is usually reversing course and trending up. The reversal occurs as short sellers exit the market and lock in profits allowing buyers to enter and take advantage of the extremely low prices.
Likewise, whenever the Stochastic indicator readings rise above 80, they imply overbought conditions signaling the underlying asset or instrument under study might have been bought too much. During overbought conditions, there is a tendency for asset prices to reverse course and move in the opposite direction.
Once overbought conditions kick in, most buyers develop cold feet and start exiting the market as they don’t expect the price to increase further. Consequently, short sellers use the opportunity to enter short positions taking advantage of the extremely high prices to sell high.
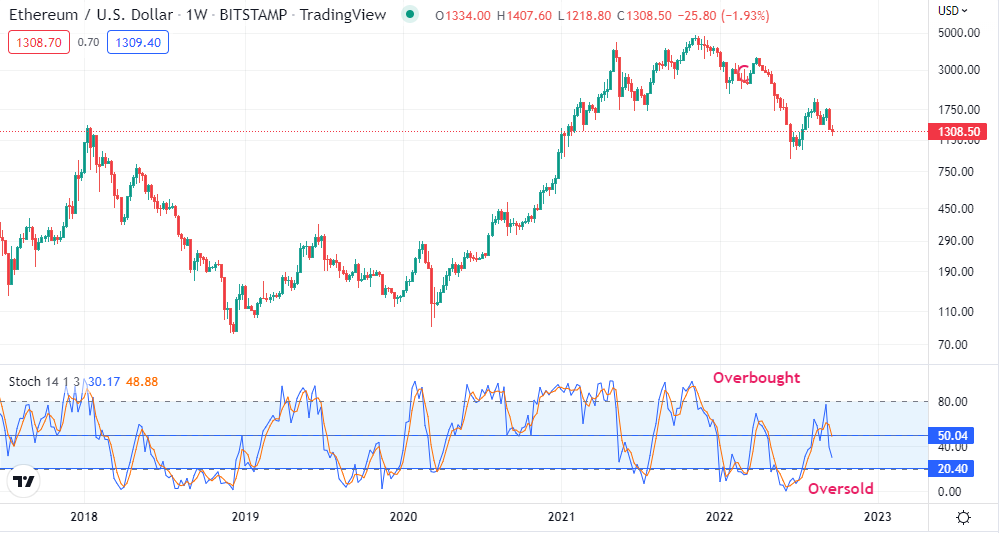
The chart above shows ETHUSD price action. It is clear that as soon the stochastic indicator signaled oversold condition on dropping to lows of 20, there is a tendency for the price to reverse course and start moving up after some time.
The oversold condition signaled to buyers that Ethereum’s price had tumbled significantly, providing an opportunity to buy low; thus, the price ended up bottoming out. Consequently, technical analysis looks for ideal entry levels to open buy positions on the RSI signaling oversold conditions.
Similarly, overbought conditions kicked in whenever the Stochastic indicator rose to or above 80, signaling its time to sell high. With RSI above 80, short sellers entered the market, overpowering bulls and pushing prices lower. Consequently, whenever the RSI reading is above 80, it signals to short sellers that it is time to open sell positions as the price is likely to correct course and move lower as part of a new downtrend.
Likewise, the 50 level is an area of interest when using the Stochastic indicator. Whenever the technical indicator rises above the 50-level from an oversold condition, it implies a shift in market sentiments from bearish to bullish. Consequently, it affirms the likelihood of price making higher highs as part of the emerging uptrend.
In contrast, the stochastics’ indicator reading tanks below 50 from overbought conditions affirming a shift in market sentiments from bullish to bearish. Consequently, prices are expected to continue tanking as part of the emerging downtrend. Therefore, whenever the stochastic indicator readings are below 50, technical analysts use this opportunity to eye sell positions as there is usually a high chance of prices tumbling.
Moving Average Convergence and Divergence
The MACD is a momentum indicator that provides reliable entry and exit signals. It comprises two moving average indicators that move up and down depending on the prevailing market momentum. Whenever the MACD line crosses the signal line from below and starts moving up, it signals a build-up in buying momentum, affirming the need to explore buy or long positions.
Similarly, whenever the MACD line crosses the signal line from the top and moves lower, it signals a build-up in bearish momentum. The crossover signals to open short or sell positions as prices always move lower. The MACD provides a reliable trading signal in trending markets instead of when the market is range bound.
Additionally, the MACD indicator comes with a histogram. Whenever the MACD line crosses the signal line and starts moving up, the histogram appears on top of the zero line. As the upward momentum increases, the size of the histogram at the top also increases in size. The larger the size of the histogram at the top, the stronger the upward momentum.
Likewise, whenever the MACD line crosses the signal line and starts moving lower, the histogram appears below the zero line. The histogram will increase in size as the selling pressure or downward momentum increases. As the downward momentum increases, technical analysts use the opportunity to eye short selling positions.
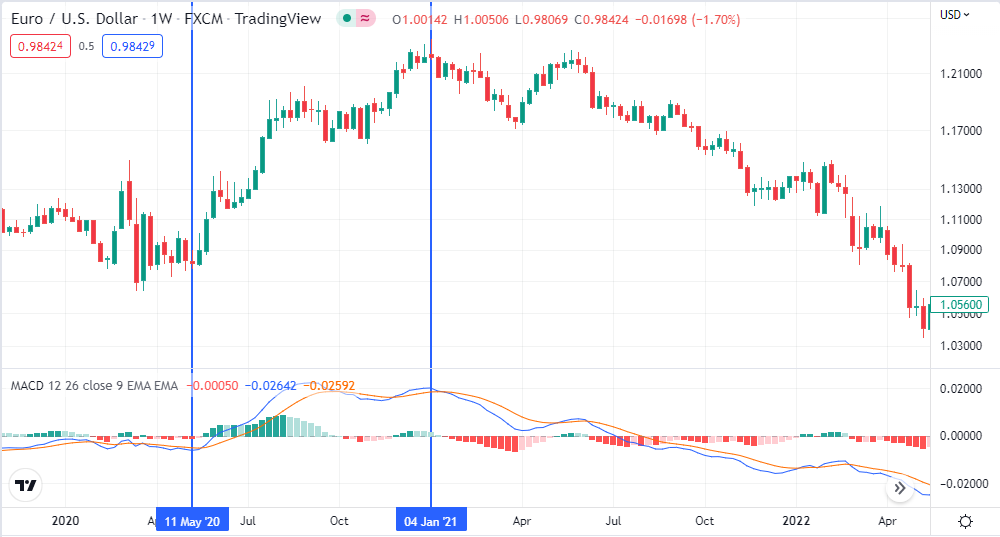
The chart above shows EURUSD price action with the MACD indicator embedded at the bottom. Around May 11, 2020, the MACD line (in blue) crossed the signal line (in orange) and moved up. The crossover affirmed a build-up in buying pressure after the price had dropped.
EURUSD ended up breaking out to the upside as the upward momentum increased. The histogram above the zero line also increased in size, affirming the uptrend and bulls in control. However, as the year came to a close, the upward momentum started fading, depicted by the MACD and the Signal line going flat at the top.
In early 2021, it was clear that the MACD line crossed the signal line from the top and started moving lower. The crossover signaled a build-up in selling pressure at the top of the chart. What followed was EURUSD edging more down afterward. While the price did try to bounce back, the selling pressure was intense, depicted by a much bigger histogram below the zero line. EURUSD ended up dropping from highs above the 1.20 level to lows of about 1.056
The Triple Trading Strategy
While it is possible to use the RSI, the Stochastic, and the MACD indicator independently, they provide the best trading signals combined. As part of the triple trading strategy, the RSI indicator is used to identify the direction price is moving. Whenever the RSI reading is above 50, it’s time to look out for long or buy positions, as the price will likely continue increasing.
Similarly, if the RSI reading is below 50, the market is trending lower, and that price is likely to continue moving lower. Consequently, it would be the best practice to only look out for sell positions to take advantage of a build-up in selling pressure.
The stochastic indicator will signal when the market is oversold or overbought. Consequently, whenever its reading exceeds 80, one should look for potential price reversal from the uptrend to a downtrend. On the other hand, whenever the stochastic reading is below 20, it affirms oversold conditions, signaling the likelihood of price bouncing back and edging higher as buyers look to buy low.
The MACD indicator provides valuable insight into the prevailing momentum. Consequently, whenever the MACD line crosses the signal line and moves up, it affirms a build-up in buying pressure. Therefore, this would be the best time to enter long or buy positions.
When the MACD indicator crosses the signal line from the top and starts moving lower, it implies a build-up in bearish momentum, implying price is likely to move lower. Consequently, this would be the best time to enter short or sell positions.
Conditions for Buy/Long Positions
The condition for opening a buy/long position is when the MACD line of the MACD indicator crosses the signal line and moves up, signaling a build-up in upward or buying momentum. There should also be a sign of a histogram above the zero line increasing in size.
Likewise, the stochastic indicator should appear to be moving up as it bottoms out of the oversold territory. Once the indicator’s readings move above the 20-level, signaling buyers are taking advantage of the extremely low prices to enter long positions.
The RSI indicator should also be in an uptrend moving above the 50-line to affirm the uptrend.
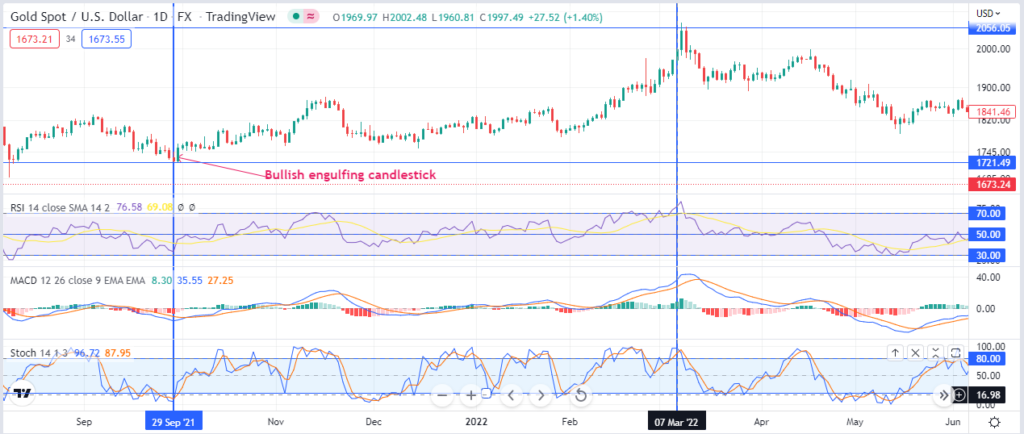
In the gold price chart above, a buy signal emerged around September 29, 2021. It is clear that the RSI bottomed out and moved towards the 50-level. The stochastic indicator also started bottoming out from the oversold level and moved up, signaling a build-up in buying pressure.
The MACD line crossing the signal line affirmed that the momentum had changed from bearish to bullish, confirming the need to look for buy or long positions. In the Price chart, the emergence of a bullish engulfing candlestick on September 30 underscored the need to enter a long position as buyers were in control.
Traders who entered long positions after September 30 ended up placing a stop loss below the $1721 handle.
Conditions for Sell/ Short Position
A sell or short position with the triple trading strategy emerges whenever the stochastic indicator is above 80, implying an overbought condition and the likelihood of a reversal. The MACD line should also cross the signal line from the top and start moving lower. The RSI changing course and pointing lower, heading towards the 50-line, affirms the need to look out for short or sell positions.
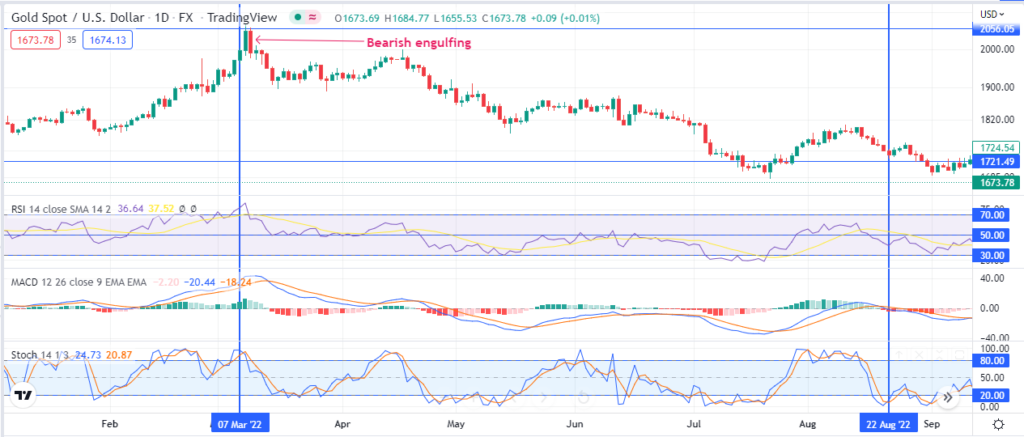
In the chart above, gold trends up between September 2021 and March 2022. However, the overbought condition started kicking around March 22, as depicted by the Stochastic indicator above 80. The MACD line crossing the signal line and moving lower signals a shift in market momentum from bullish to bearish, affirming the need to look for short or sell positions. The RSI has also started edging lower, signaling an emerging downtrend.
The formation of a bearish engulfing candlestick at the top of the chart was a more than enough signal to enter a short position as the market had turned bearish with sellers overpowering buyers. Any person who entered a short or sell position after the bearish engulfing candlestick placed a stop loss above the $2056 level.
Bottom Line
The MACD RSI and Stochastic are some of the best technical analysis indicators. The indicator provides valuable insight into the prevailing market sentiment and action. Additionally, they help ascertain the direction price will likely move based on past price action. When combined, the indicators can provide entry and exit signals.